This package performs Three-Mode Principal Components using Tuckers Models and plot interactive Biplot.Some experiment design generated three-way or three-mode data, repeated observations of a set of attributes for a set of individuals in different conditions. The information was displayed in a three-dimensional array, and the structure of the data was explored using Three-Mode Principal Component Analysis, the Tucker-2 Model.
You can install tuckerR.mmgg from github with:
# install.packages("devtools")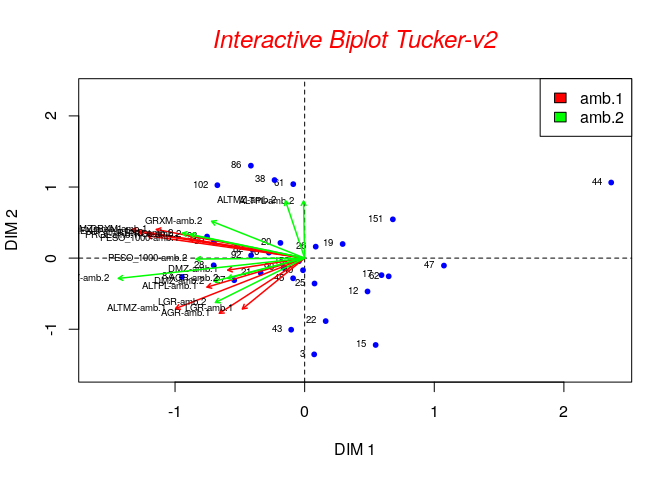
devtools::install_github("gusart/tuckerR_mmgg")The most important contribution of this package are the interactive
biplot graphics and the application of the diffit()
function to find the best combination of components to retain.
This is a basic example which shows you how to solve a common problem:
library(tuckerR.mmgg)
#>
#> Attaching package: 'tuckerR.mmgg'
#> The following object is masked from 'package:graphics':
#>
#>     plot
data(maize_pop)
output <- tucker2R(maize_pop,amb=2,stand=TRUE,nc1=3,nc2=3)output$matrizG
#> [,1] [,2] [,3] [,4] [,5] [,6]
#> [1,] 10.260719 1.847900 3.553432 8.380775 3.021522 -0.5999851
#> [2,] -2.014825 3.989558 3.306571 -1.322206 3.332721 -4.2685767
#> [3,] -1.290695 3.355101 -3.429868 1.325232 3.341179 3.2866310
#> [,1] [,2] [,3] [,4] [,5] [,6]
#> [1,] 10.260719 1.847900 3.553432 8.380775 3.021522 -0.5999851
#> [2,] -2.014825 3.989558 3.306571 -1.322206 3.332721 -4.2685767
#> [3,] -1.290695 3.355101 -3.429868 1.325232 3.341179 3.2866310plot(output)