An R package to generate robust disease-specific response signatures from the LINCS-L1000 data that are independent of time, concentration, and cell-line. Based on the cell lines used as surrogates, the returned profiles represent the unique transcriptional changes induced by a compound in a given disease.
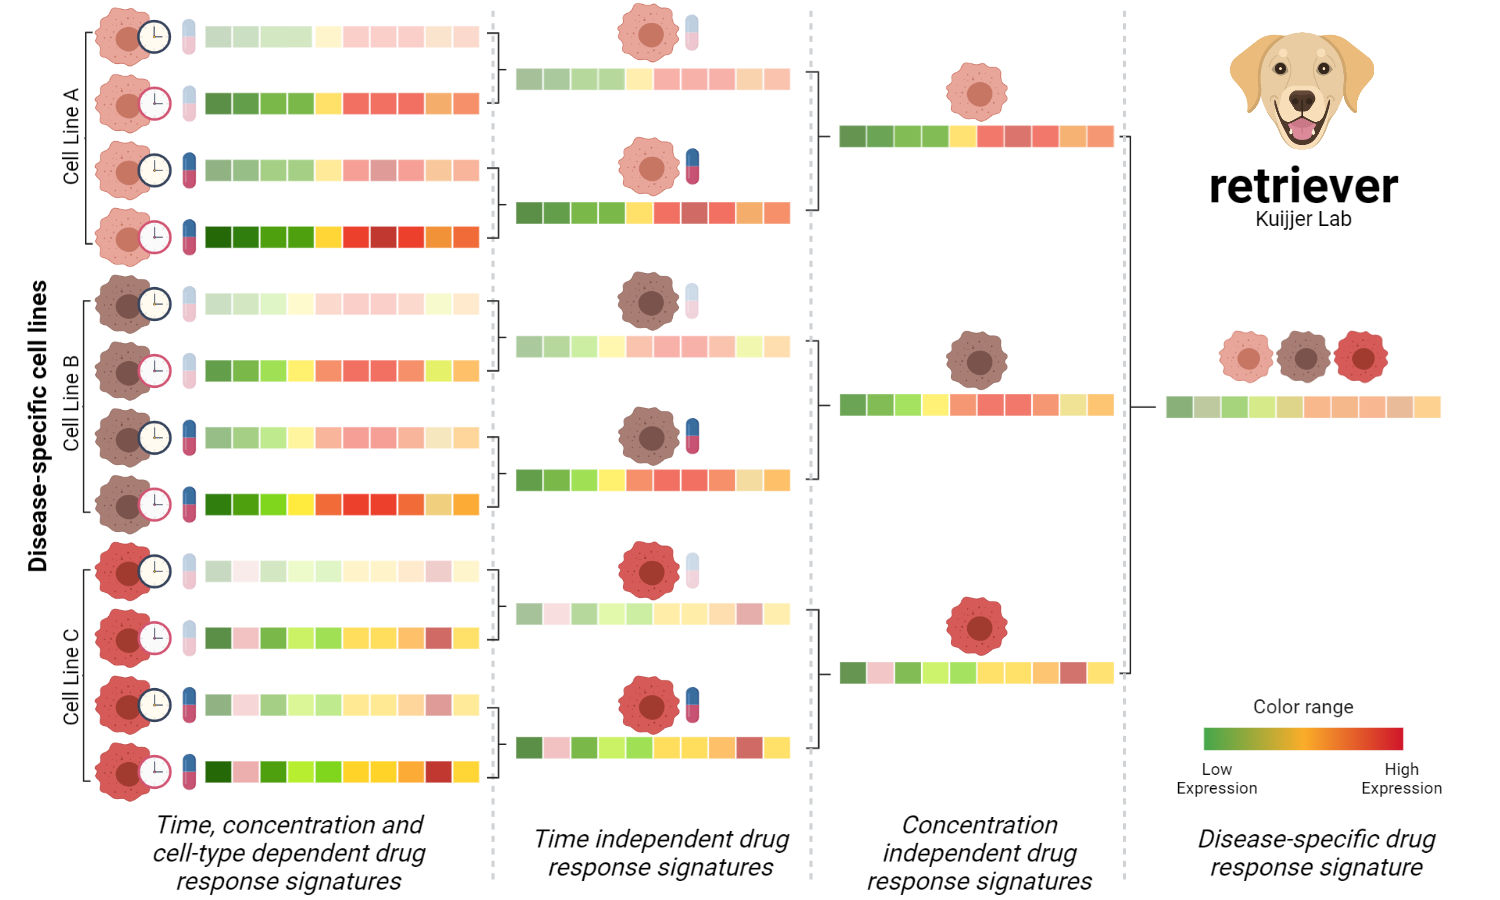
The procedure to generate disease-specific drug-response profiles was divided into three steps. The first is to remove the time dependency, the second is to remove the concentration dependency, and the third is to remove the cell line dependency and generate disease-specific robust drug response profiles.
1 - In the first step, we take the response profile of a given cell line to the same compound under the same concentration at different time points and averaged them. Then, the descriptive power of the generated profile to represent the drug response at a given concentration in the cell line, independently of time, is evaluated using Spearman’s correlation coefficient. If the correlation with the generated profile is larger than 0.6, then the averaged profile is returned. The original drug response profiles that do not reach the threshold are removed, and the averaged profile is recomputed using the ones above the threshold, this procedure ensures the removal of aberrant or insufficient cellular responses. Only averaged signatures of at least two profiles are used in the second step.
2 - In the second step, we take the stable time-independent signature profiles of the compounds at a particular concentration in the same cell line. To remove the concentration dependency, we applied the same procedure described in the first step over the averaged profiles. The profiles returned by the second step are the stable ones independent of the time and concentration under the same cell line.
3 - In the last step, to generate disease-specific drug response profiles we again applied the procedure described in the step 1 to the stable response profiles to the same compounds in the three cell lines used as surrogate of the triple-negative breast cancer in the LINCS-L1000 project. The profiles returned by the third step are robust disease-specific transcriptional signatures representing the changes that are unique for a compound in triple-negative breast cancer.
retriever is under active development, you can install it, using the following command:
library(remotes)
install_github('kuijjerlab/retriever')
library(retriever)
After loaded, retriever can be used to generate robust disease-specific response profiles to drugs. A list of diseases and the cell lines used as surrogates by the LINCS-L1000 project are available using the following command:
data(CLbyDisease)
CLbyDisease

# $`Adult acute monocytic leukemia`
# [1] "NOMO1" "U937"
#
# $`Adult acute myeloid leukemia`
# [1] "PL21" "SKM1" "HL60"
#
# $`Triple negative breast cancer`
# [1] "BT20"     "HS578T"   "MDAMB231"
#
# $`Colon adenocarcinoma `
# [1] "CL34"    "SNU1040"
#
# $`Colon carcinoma`
# [1] "HCT116" "HT115"  "MDST8"  "RKO"
#
# $`Colon adenocarcinoma`
# [1] "HT29"  "LOVO"  "SNUC4" "SW480" "SW620" "SW948"
#
# $`Cecum adenocarcinoma`
# [1] "NCIH508" "SNUC5"
#
# $`Lung adenocarcinoma`
# [1] "A549"     "DV90"     "HCC515"   "NCIH2073" "SKLU1"
#
# $`Lung large cell carcinoma`
# [1] "CORL23" "H1299"  "T3M10"
#
# $`Lung small cell carcinoma`
# [1] "NCIH1694" "NCIH1836"
#
# $`Ovarian mucinous adenocarcinoma`
# [1] "COV644" "EFO27"
#
# $`Prostate carcinoma`
# [1] "PC3"  "VCAP"
#
# $Melanoma
# [1] "SKMEL1"  "SKMEL28"
#
# $`Endometrial adenocarcinoma`
# [1] "HEC108" "JHUEM2" "SNGM"
For example, to generate the response profiles associated with triple negative breast cancer (TNBC), you can use:
TNBC <- retriever(cellLines = CLbyDisease[['Triple negative breast cancer']])
TNBC[1:10,1:5]

#          A-443644     ABT-737      afatinib AKT-inhibitor-1-2  alvocidib
# PSME1 -0.54192016 -0.32073752  0.0003200528       -0.13784998  0.3831446
# CISD1  0.95272485 -0.06563698 -0.2246306618       -0.09334698  0.7919193
# SPDEF  1.80940869 -0.17057088 -0.2363669915       -0.03319066  1.3085641
# ATF1  -0.51465317 -0.31810595  0.2534131038       -0.04169106 -2.2066398
# RHEB   0.40585042 -0.03836748  0.0316147974       -0.16554922  0.1577878
# IGF1R  0.50137738 -0.14530749 -0.1751112976        0.85423828 -2.1489664
# FOXO3  0.19299259  0.49652542  0.1174081872       -0.18846343 -1.2318300
# GSTM2 -0.08463186 -0.16488149 -0.0245623439       -0.45889019  1.4588289
# RHOA   0.24047472 -0.31945557 -0.3189194151       -0.38868632  0.6610283
# IL1B   1.06312281  0.36044012  0.3321292503       -0.48650377  1.5653718
The output is a matrix of 1001 genes by 152 robust response profiles. This matrix can be used to generate all possible two-drug response profiles as follows:
combinationsTNBC <- profileCombinations(TNBC)
combinationsTNBC[1:10,1:4]

#       A-443644 + ABT-737 A-443644 + afatinib A-443644 + AKT-inhibitor-1-2 A-443644 + alvocidib
# PSME1        -0.43132884         -0.27080006                  -0.33988507          -0.07938778
# CISD1         0.44354393          0.36404709                   0.42968893           0.87232207
# SPDEF         0.81941891          0.78652085                   0.88810902           1.55898638
# ATF1         -0.41637956         -0.13062003                  -0.27817211          -1.36064650
# RHEB          0.18374147          0.21873261                   0.12015060           0.28181909
# IGF1R         0.17803494          0.16313304                   0.67780783          -0.82379451
# FOXO3         0.34475900          0.15520039                   0.00226458          -0.51941869
# GSTM2        -0.12475668         -0.05459710                  -0.27176103           0.68709853
# RHOA         -0.03949042         -0.03922235                  -0.07410580           0.45075152
# IL1B          0.71178147          0.69762603                   0.28830952           1.31424730
In this case, the output is a matrix of 1001 genes by 11476 profile combinations. The profiles and the combinations can be used to evaluate the pharmacological potential of the compounds to act as antagonists of the disease under study.