The goal of rLFT is to assist users in extracting data from linear features and shp files. This is accomplished with the help of the sf package and by utilizing linear referencing. Linear referencing gives us a way to collect data as points on a line rather than using (x,y) coordinates. We can then use measurements along features to locate these points. This method of collecting data has a wide variety of applications and can be used in various ways. For more information on linear referencing see ArcGIS’s definition
You can install the released version of rLFT from CRAN with:
install.packages("rLFT")This is a basic example:
library(rLFT)
## Loading in data from shp file. If you want to use your own shp file
## use the sf library function st_read("directory of desired shp file").
## For more information on the sf package see: https://cran.r-project.org/web/packages/sf/index.html
# data("shpObject")
outputTable <- bct(shpObject, 50, 100)
#>    user  system elapsed
#>    0.04    0.00    0.05
View the resulting data from “bct()” of the first 10 rows:
head(outputTable, 10)
#>    RID StepSize WindowSize RawConvexity ConvexityIndex Sinuosity
#> 1    1        0        100       28.549          0.571     0.635
#> 2    1       50        100      -18.641         -0.373     0.578
#> 3    1      100        100      -19.891         -0.398     0.625
#> 4    1      150        100       24.944          0.499     0.623
#> 5    1      200        100        2.458          0.049     0.501
#> 6    1      250        100        9.879          0.198     0.512
#> 7    1      300        100       -4.640         -0.093     0.513
#> 8    1      350        100       -6.607         -0.132     0.553
#> 9    1      400        100      -19.972         -0.399     0.600
#> 10   1      450        100       -1.041         -0.021     0.517
#>    Midpoint X Midpoint Y
#> 1    354048.5    1226757
#> 2    354045.2    1226806
#> 3    354010.6    1226834
#> 4    353967.2    1226824
#> 5    353935.4    1226862
#> 6    353907.5    1226904
#> 7    353898.0    1226953
#> 8    353879.9    1226997
#> 9    353853.1    1227031
#> 10   353803.7    1227031
If you want to view the entire table use:
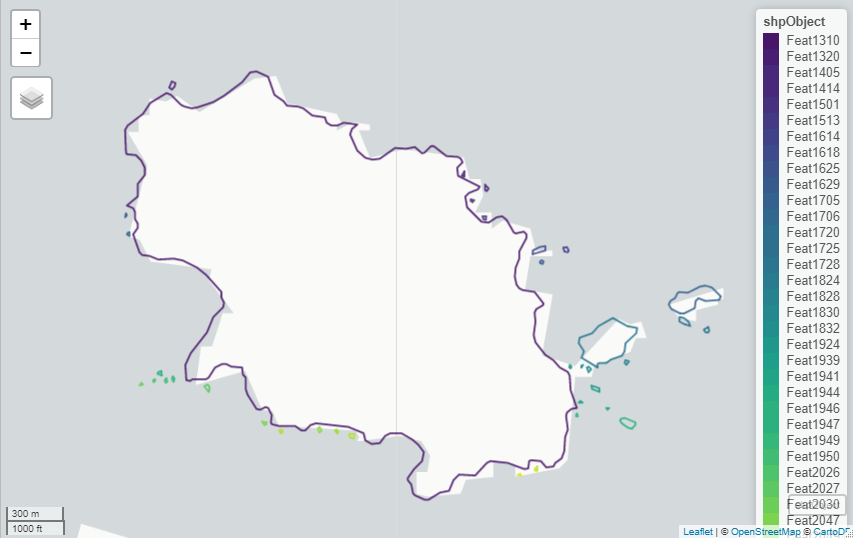
View(outputTable)Here is a map view of the sf Object that was used to get the above data (accessed using the mapview library):