Implements TRACDS (Temporal Relationships between Clusters for Data Streams), a generalization of Extensible Markov Model (EMM), to model transition probabilities in sequence data. TRACDS adds a temporal or order model to data stream clustering by superimposing a dynamically adapting Markov Chain. Also provides an implementation of EMM (TRACDS on top of tNN data stream clustering).
Interface classes DSC_tNN and DSC_EMM for the stream package are provided.
To cite package ‘rEMM’ in publications use:
Hahsler M, Dunham M (2010). “rEMM: Extensible Markov Model for Data Stream Clustering in R.” Journal of Statistical Software, 35(5), 1-31. ISSN 1548-7660, doi:10.18637/jss.v035.i05 https://doi.org/10.18637/jss.v035.i05.
@Article{,
  title = {{rEMM}: Extensible Markov Model for Data Stream Clustering in {R}},
  author = {Michael Hahsler and Margaret H. Dunham},
  journal = {Journal of Statistical Software},
  year = {2010},
  volume = {35},
  number = {5},
  pages = {1--31},
  doi = {10.18637/jss.v035.i05},
  issn = {1548-7660},
}Stable CRAN version: Install from within R with
install.packages("rEMM")Current development version: Install from r-universe.
install.packages("rEMM",
repos = c("https://mhahsler.r-universe.dev". "https://cloud.r-project.org/"))We use a artificial dataset with a mixture of four clusters components. Points are generated using a fixed sequence <1,2,1,3,4> through the four clusters. The lines below indicate the sequence.
library(rEMM)

data("EMMsim")

plot(EMMsim_train, pch = NA)
lines(EMMsim_train, col = "gray")
points(EMMsim_train, pch = EMMsim_sequence_train)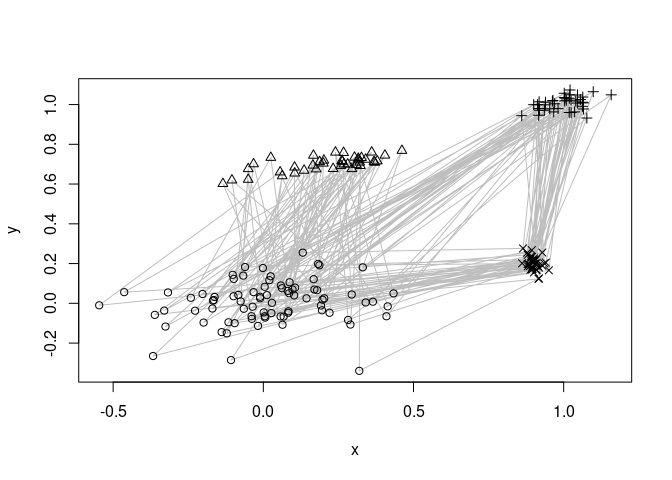
EMM recovers the components and the sequence information. We use EMM and then recluster the found structure assuming that we know that there are 4 components. The graph below represents a Markov model of the found sequence.
emm <- EMM(threshold = 0.1, measure = "euclidean")
build(emm, EMMsim_train)
emmc <- recluster_hclust(emm, k = 4, method = "average")
plot(emmc)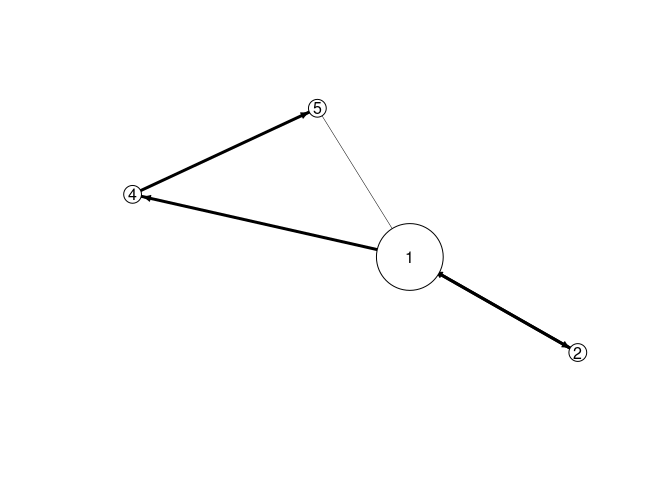
We can now score new sequences (we use a test sequence created in the same way as the training data) by calculating the product the transition probabilities in the model. The high score indicates this.
score(emmc, EMMsim_test)## [1] 0.71Development of this package was supported in part by NSF IIS-0948893 and R21HG005912 from the National Human Genome Research Institute.