![]()
The goal of pmev is to implement project management tracking metrics as outlined in the Project Management Body of Knowledge (PMBOK) manual which can be found .
You can install the development version of pmev from GitHub with:
# install.packages("devtools")
devtools::install_github("david-hammond/pmev")library(pmev)
data(project)
earnedvalue <- ev$new(start = project$start,
end = project$end,
progress = project$progress,
planned_cost = project$planned_cost,
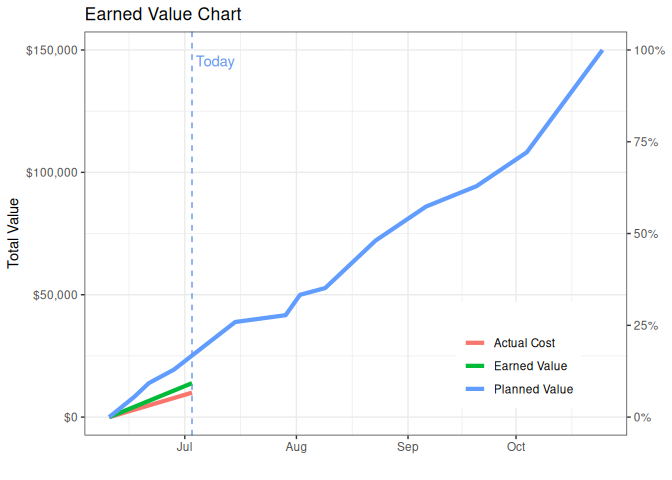
project_value = 150000,
cost_to_date = 10000,
date = "2024-07-03")
print(earnedvalue$earned_value)
#> date total_value budget_at_completion project_complete
#> 1 2024-07-03 150000 47934 0.09
#> schedule_complete planned_value earned_value actual_cost schedule_variance
#> 1 -0.08 25144.5 13878.46 10000 -11266.04
#> cost_variance cost_performance_index estimate_at_completion
#> 1 3878.46 1.39 108081.2
#> estimate_to_complete variance_at_completion to_complete_performance_index
#> 1 98081.17 -60147.17 0.97The Earned Value can then be plotted in the following way.
plot(earnedvalue)