![]()

![]()
The goal of ggsolvencyii is to provide ‘ggplot2’-geom’s to show the composition of the Solvency (II) Capital Requirement (SCR) from (diversified) risks and subrisks, whether for standard formula (SF) or (partial) intern models (IM/PIM).
You can install ggsolvencyii from Cran (stable release)
install.packages("ggsolvencyii")or (develoment version) from Github:
# install.packages("devtools")
devtools::install_github("vanzanden/ggsolvencyii")This README is a short version of the vignette ‘ggsolvencyii’ at https://cran.r-project.org/web/packages/ggsolvencyii/index.html which shows the same examples with more code. The complete annotated code for the first figure is shown in vignette ‘showcase’. A further elaboration on the inner workings of the package and the use of parameter-values and tables can be found in vignette “coding overview’.
ggsolvencyii builds on ggplot-functionality and provides three
geom’s: geom_sii_risksurface,
geom_sii_riskoutline and
geom_sii_riskconnection.
These three geom’s were used to produce the following showcase plot which might be used for an ORSA (Own Risk and Solvency Assessment) report.
#> scaling is based on inputvalue (maxscrvalue) of 25.7433642812936
#> scaling is based on a max (level= 1) value of 25.7433642812936
#> scaling is based on a max (level= 1) value of 25.7433642812936
#> scaling is based on a max (level= 1) value of 25.7433642812936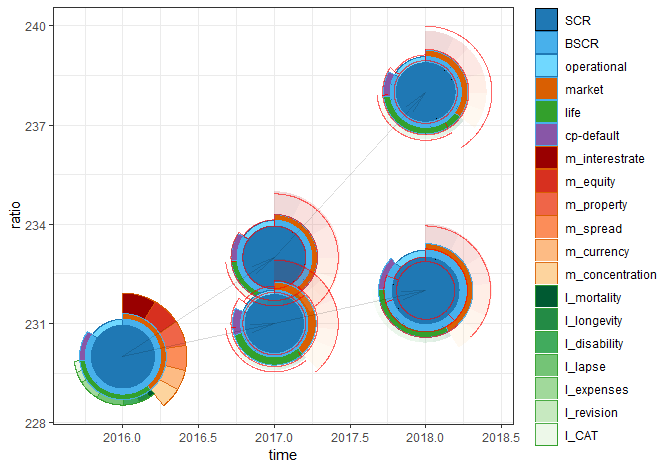
The total surface (to the centerpoint of each circle) of the outer segments show the size of undiversified risks. Diversification is made visible by the difference between the risk segment and the next segment nearer to the center of the plot. The red (out)lines are displayed for comparison with the previous SCR buildup.
An life insurer reports its solvency ratio following Standard Formula
rules, with English names for all risks. It has a set of risks,
diversification effects, and accumulations to the SCR for the current
situation (‘id’=1) and two two-year ORSA scenarios.
The SCR composition of the current situation (id = 1) is shown below
where sii_z_ex1_data a tidyverse transformation is of the
data.
ggplot() +
  geom_sii_risksurface(
    data = sii_z_ex1_data[sii_z_ex1_data$id == 1, ],
    mapping = aes(x = time, y = ratio, id = id, value = value,
                           description = description,
                           fill = description, color = description) ) +
theme_bw() +
scale_fill_manual(name = "Risks",values = sii_x_fillcolors_sf16_eng) +
scale_color_manual(name = "Risks",values = sii_x_edgecolors_sf16_eng)
#> scaling is based on a max (level= 1) value of 23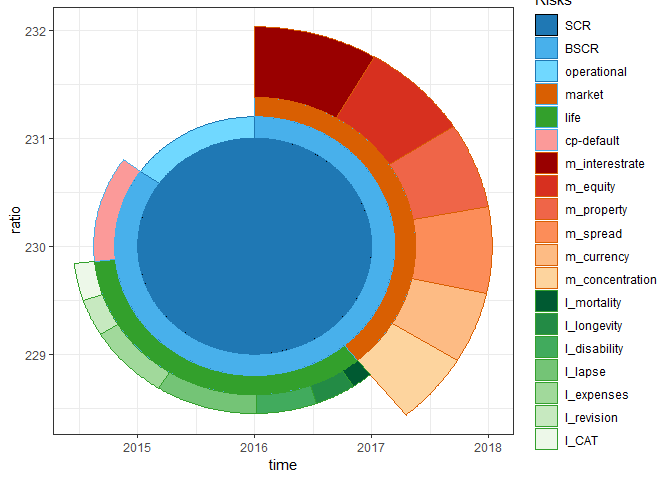
Geom_sii_risksurface uses one default table for this
plot sii_structure_sf16_eng. It defines each risks by
indicating from which combined ‘child’-risks and diversification (suffix
‘d’) it is made up. Passing another structure table makes this geom
usable for localisation or for internal models.
To prevent cluttering of the legend it is possible to group the
smallest items of a level by providing a levelmax-table in such a way
that the indicated maximum items in that level is not exceded. the
example is on another dataset sii_z_ex2_data, with only one
SCR result.
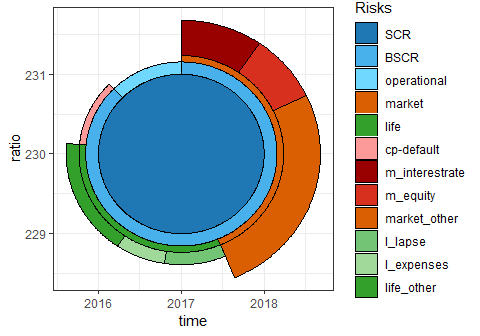
rotationdescription Rotates the plot in such a way that
the indicated item (can be on either level, i.e. works also on ‘life’ or
‘operational’) is plotted on just on the righthandside of ‘12 o’clock’.
`rotationdegrees’ provides an added rotation. The example rotates
‘m_equity’ to 12 ’o clock, and then 45 degrees counter clockwise.
The option ‘squared’ makes a square plot, with the surface of all
segments still in proportion.
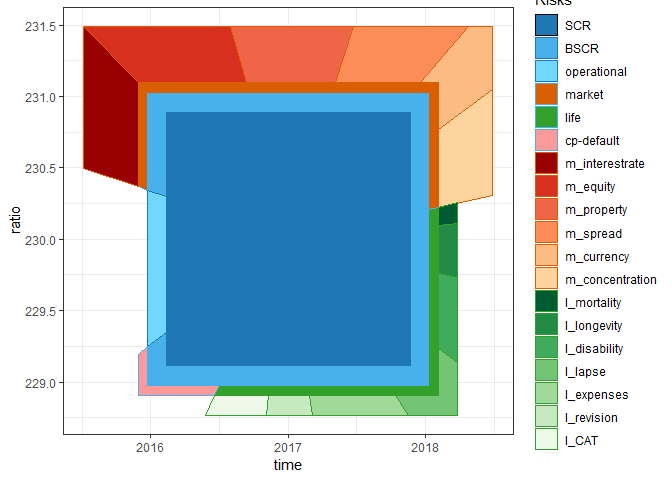
additional parameters, some in the form of tables, can be used for determing what parts of the calculated circle-segments to plot (‘plotdetails’), scaling (‘maxscrvalue’, ‘scalingx’, ‘scalingy’), or for easy comparison between two instances of a SCR buildup (aesthetic ‘comparewithid’).