
ggarchery is intended to extend ggplot2’s handling of segments with arrowheads. At present it contains one geom and one position adjustment.
geom_arrowsegment()
allows placement of one or more arrowheads at any point on a
segmentFirst, let’s generate some data that would be understood by ggplot2’s normal
geom_segment():
library(tidyverse)
library(ggarchery)

tbl <- tibble(x = c(0.1, 0.2), xend = c(0.1, 0.8), y = c(0.1, 0.5), yend = c(0.7, 0.9))
The default behaviour of geom_arrowsegment() mimics that
of geom_segment(arrow = arrow())
ggplot(tbl) +
  geom_segment(aes(x = x, xend = xend, y = y, yend = yend), arrow = arrow()) +
  xlim(c(0,1)) +
  ylim(c(0,1))
ggplot(tbl) +
  geom_arrowsegment(aes(x = x, xend = xend, y = y, yend = yend)) +
  xlim(c(0,1)) +
  ylim(c(0,1))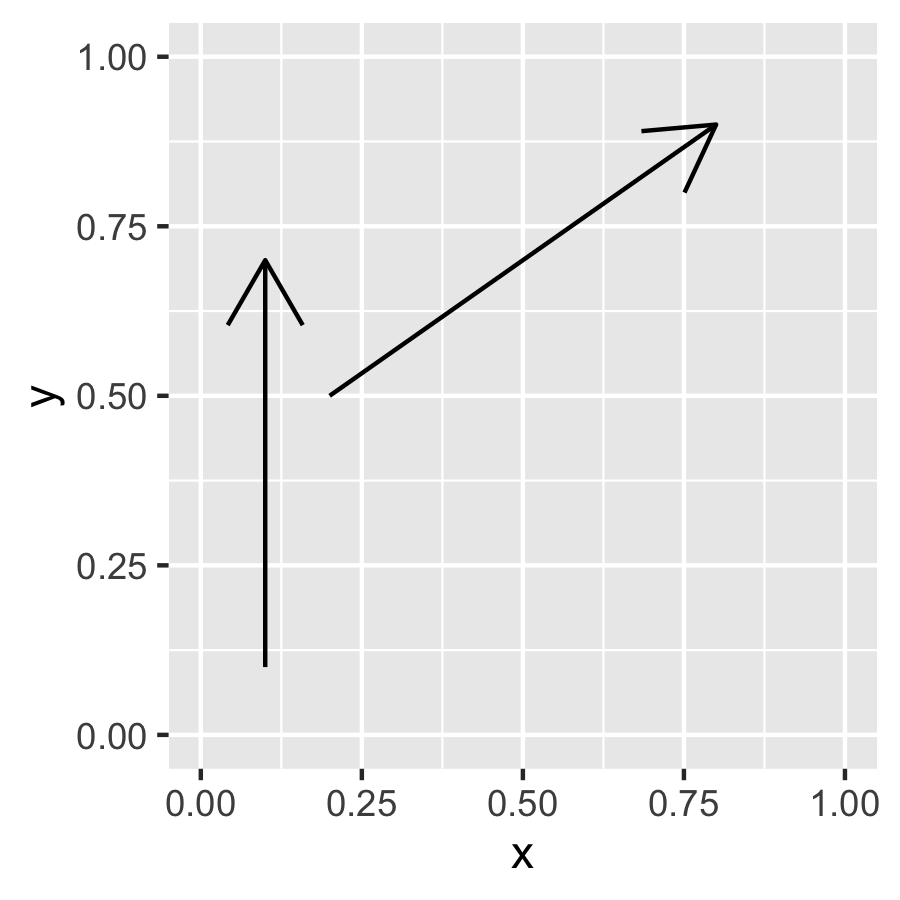
The arrows parameter of geom_arrowsegment()
also behaves exactly like the arrow parameter of
geom_segment, as a call to grid::arrow():
ggplot(tbl) +
  geom_arrowsegment(aes(x = x, xend = xend, y = y, yend = yend),
                    arrows = arrow(type = 'closed')) +
  xlim(c(0,1)) +
  ylim(c(0,1))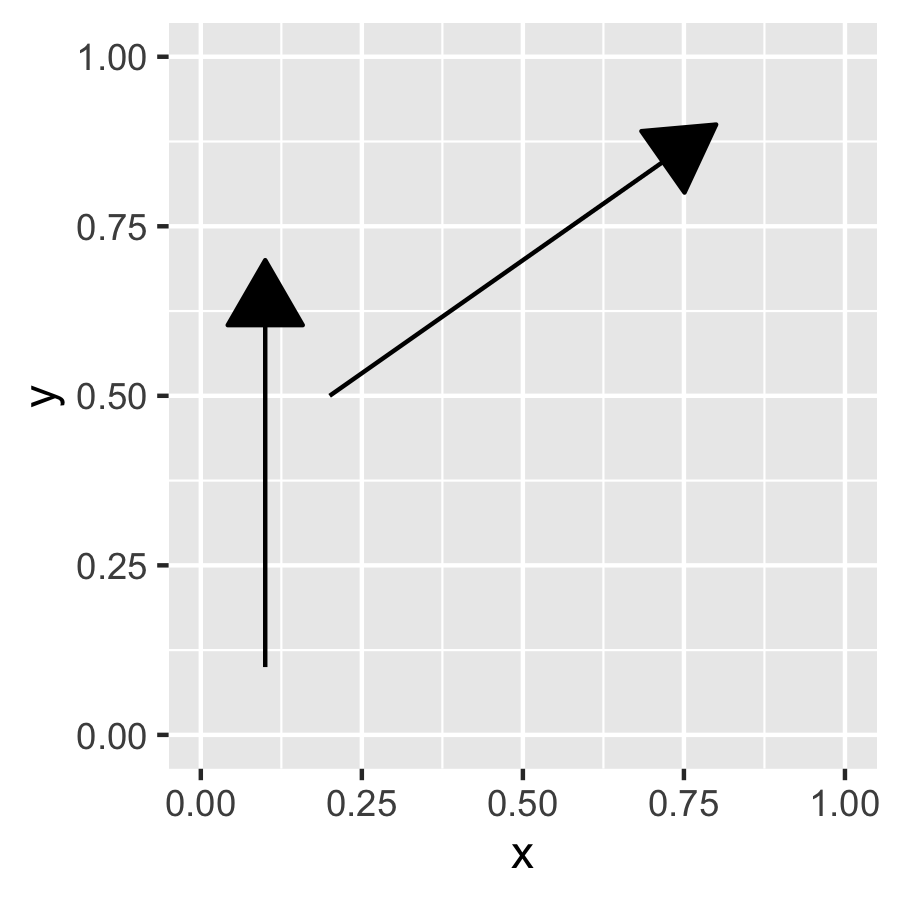
Now for the interesting bit. Suppose that we would like the arrowhead
to appear at the midpoint of the segment, rather than the end. This can
be done by specifying arrow_positions = 0.5.
ggplot(tbl) +
  geom_arrowsegment(aes(x = x, xend = xend, y = y, yend = yend), arrow_positions = 0.5) +
  xlim(c(0,1)) +
  ylim(c(0,1))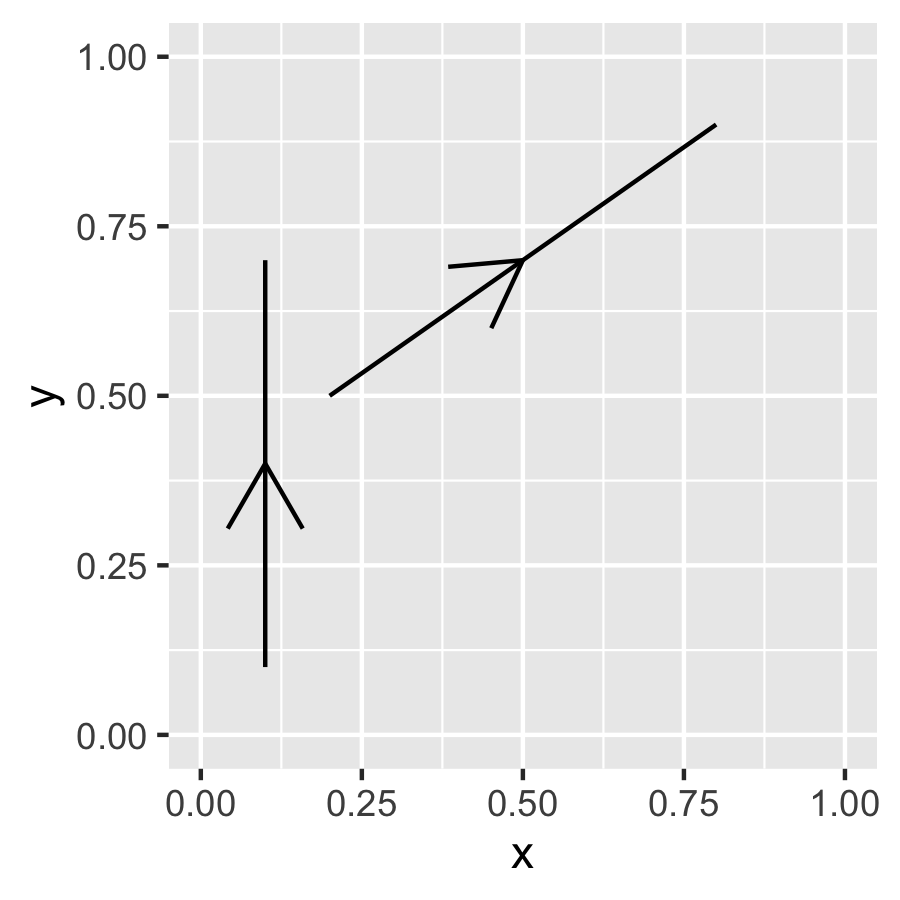
Control of the arrow segment works as before:
ggplot(tbl) +
  geom_arrowsegment(aes(x = x, xend = xend, y = y, yend = yend),
                    arrow_positions = 0.5,
                    arrows = arrow(type = 'closed')) +
  xlim(c(0,1)) +
  ylim(c(0,1))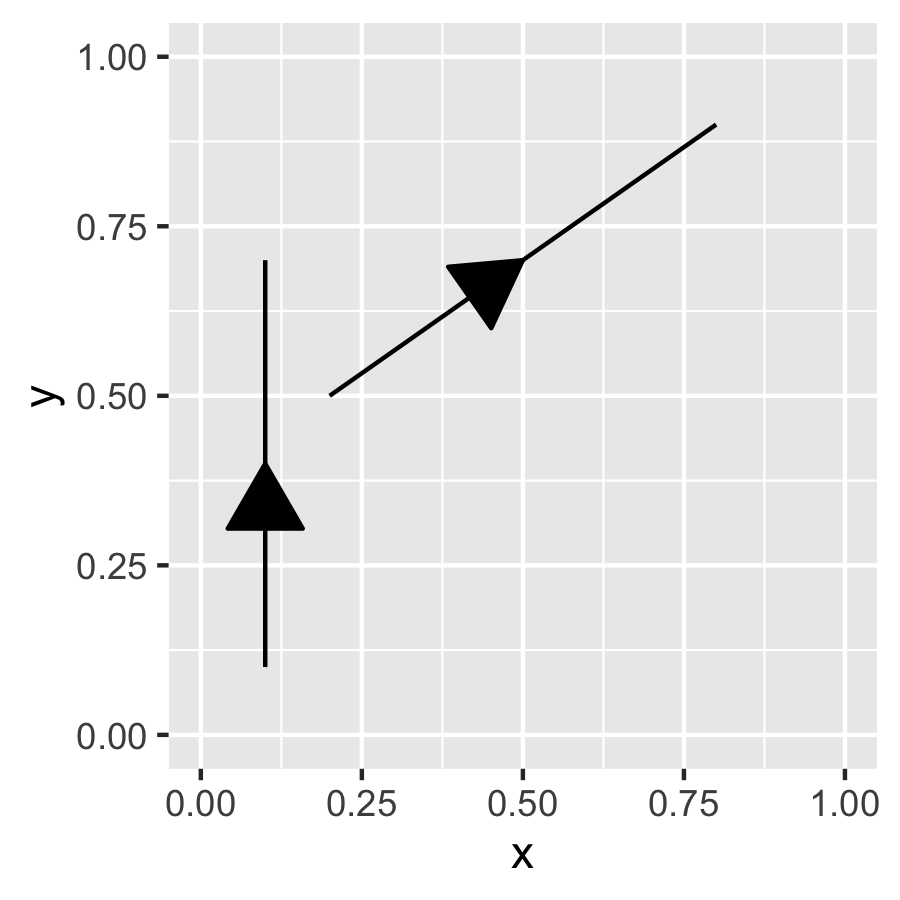
Other aesthetics also work as you would hope. There is a subtle
difference in the legend as displayed by geom_segment and
geom_arrowsegment, however:
tbl <- tbl %>% mutate(col = c("A", "B"))

ggplot(tbl) +
  geom_arrowsegment(aes(x = x, xend = xend, y = y, yend = yend, col = col),
                    arrow_positions = 0.5)  +
  xlim(c(0,1)) +
  ylim(c(0,1))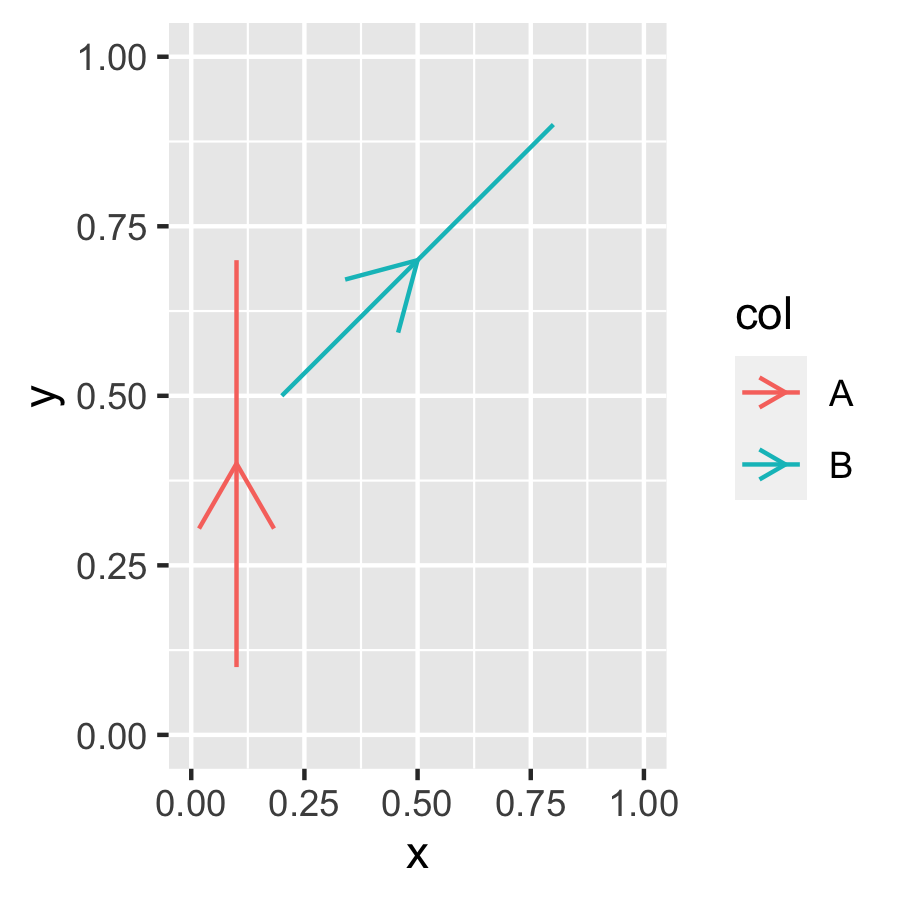
Another key way that geom_arrowsegment differs from
geom_segment is that it has a working fill
aesthetic. This is only visible if the arrowhead is closed. Note that it
must be specified as fill even if you want it to simply
match the colour aesthetic, another difference in behaviour
from geom_segment.
ggplot(tbl) +
  geom_arrowsegment(aes(x = x, xend = xend, y = y, yend = yend, fill = col),
                    arrow_positions = 0.5, arrows = arrow(type = "closed"))  +
  xlim(c(0,1)) +
  ylim(c(0,1))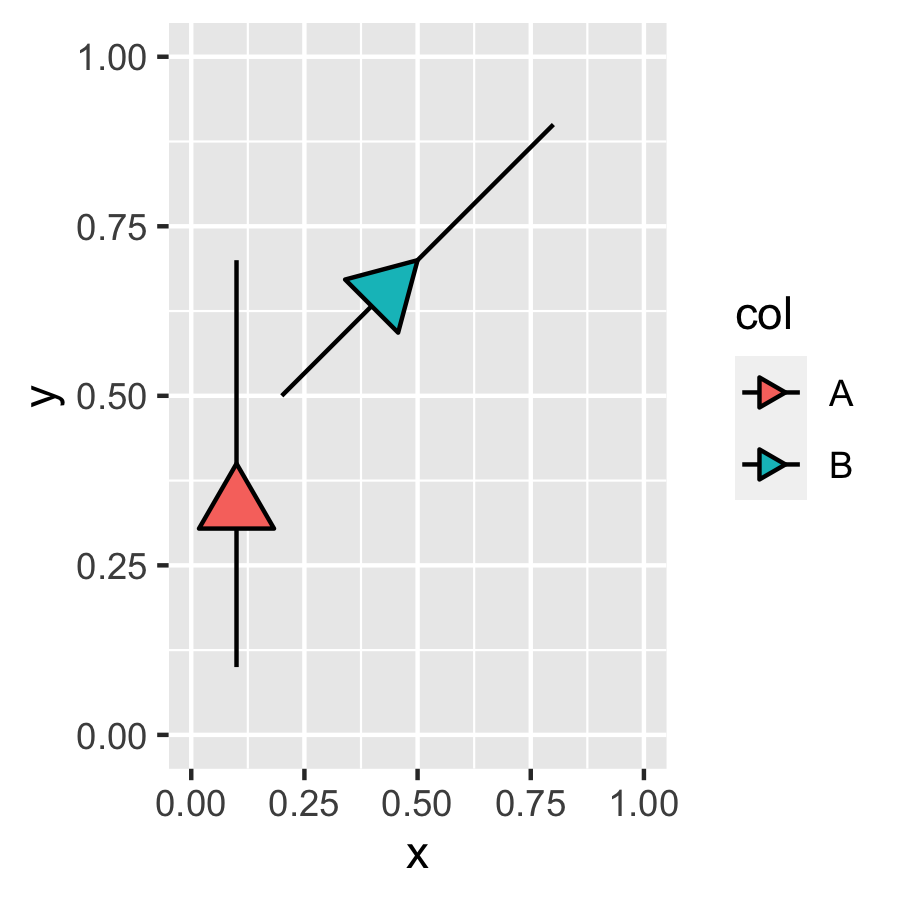
ggplot(tbl) +
  geom_arrowsegment(aes(x = x, xend = xend, y = y, yend = yend, col = col),
                      arrow_positions = 0.5, arrows = arrow(type = "closed"))  +
  xlim(c(0,1)) +
  ylim(c(0,1))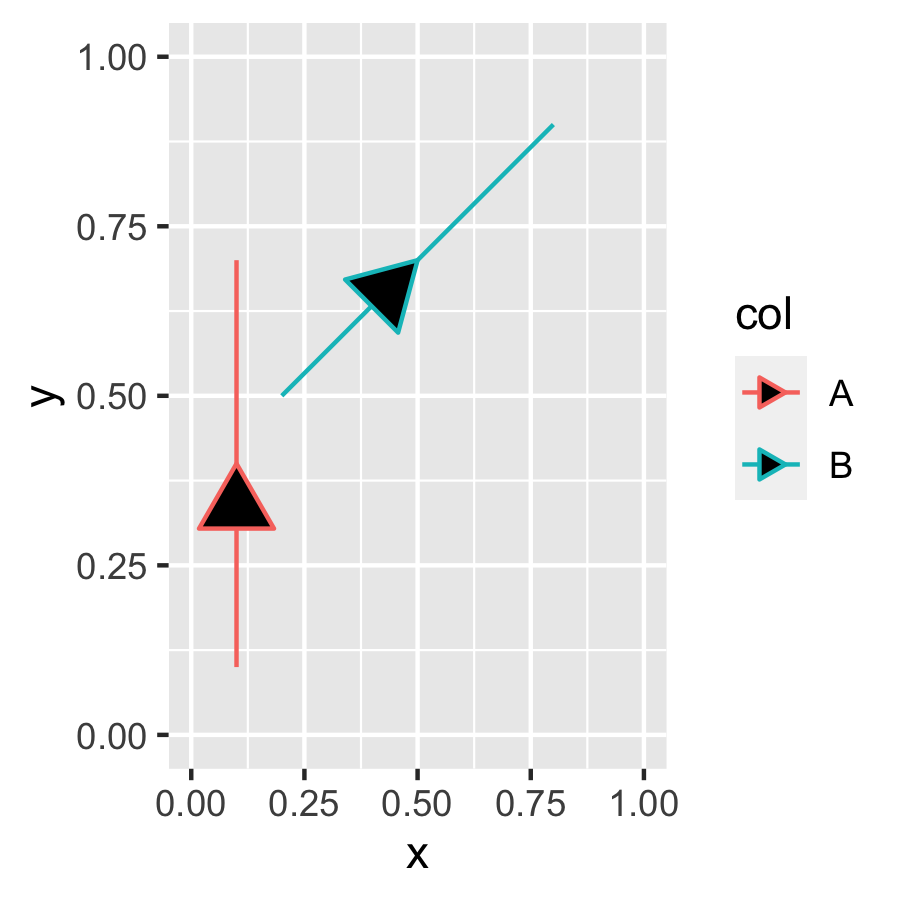
ggplot(tbl) +
  geom_arrowsegment(aes(x = x, xend = xend, y = y, yend = yend,
                        fill = col, col = col),
                    arrow_positions = 0.5,
                    arrows = arrow(type = "closed"))  +
  xlim(c(0,1)) +
  ylim(c(0,1))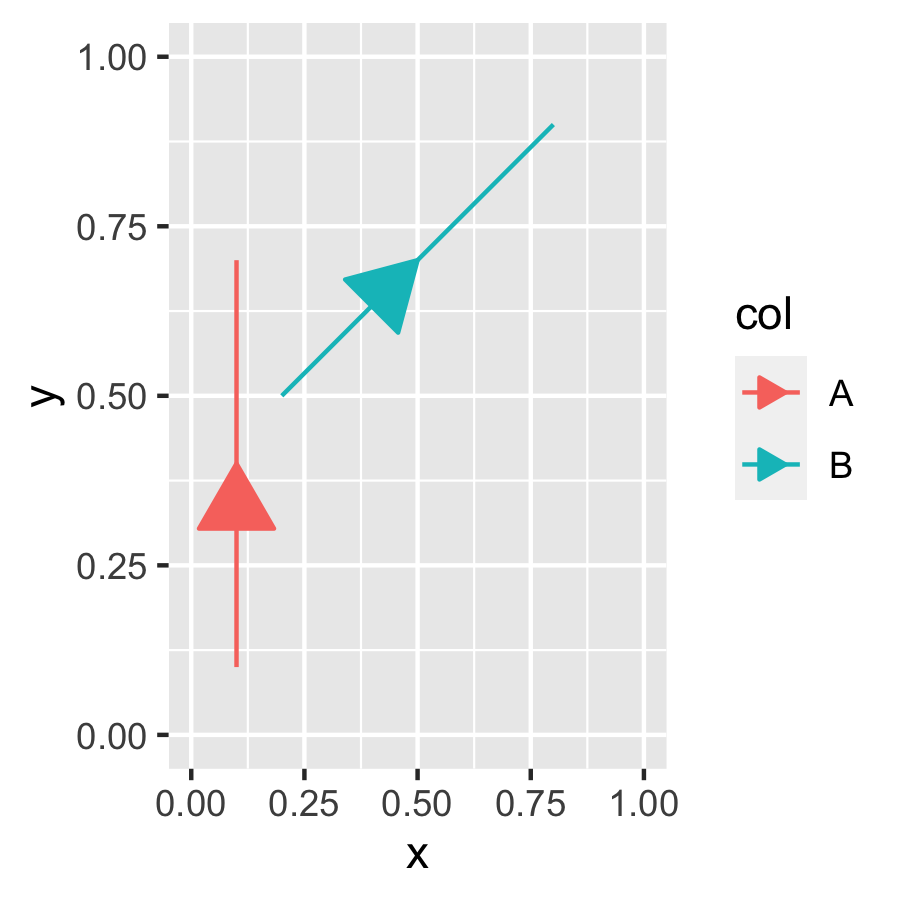
You can also define multiple arrowheads by making
arrow_positions a vector of length greater than 1. All
values are expected to fall between 0 and 1, and not be exactly 0:
ggplot(tbl) +
  geom_arrowsegment(aes(x = x, xend = xend, y = y, yend = yend),
                    arrow_positions = c(0.25, 0.75))  +
  xlim(c(0,1)) +
  ylim(c(0,1))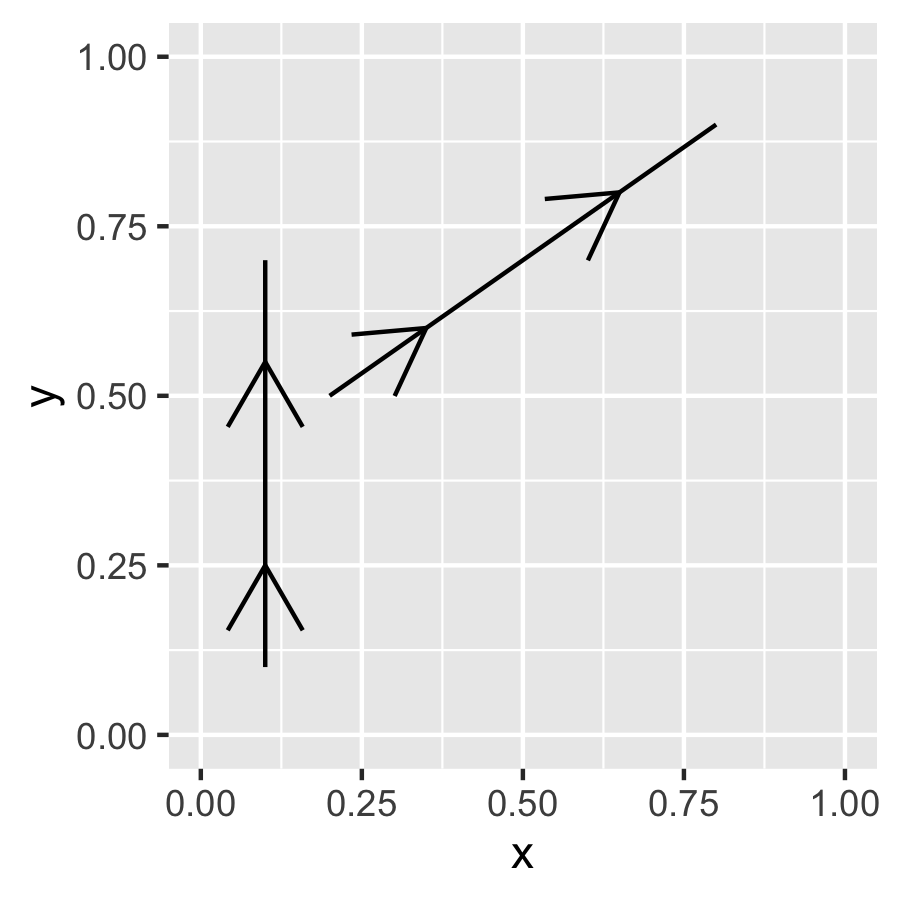
If one value is 1, then the final arrowhead appears at the end:
ggplot(tbl) +
  geom_arrowsegment(aes(x = x, xend = xend, y = y, yend = yend),
                    arrow_positions = c(0.25, 1))  +
  xlim(c(0,1)) +
  ylim(c(0,1))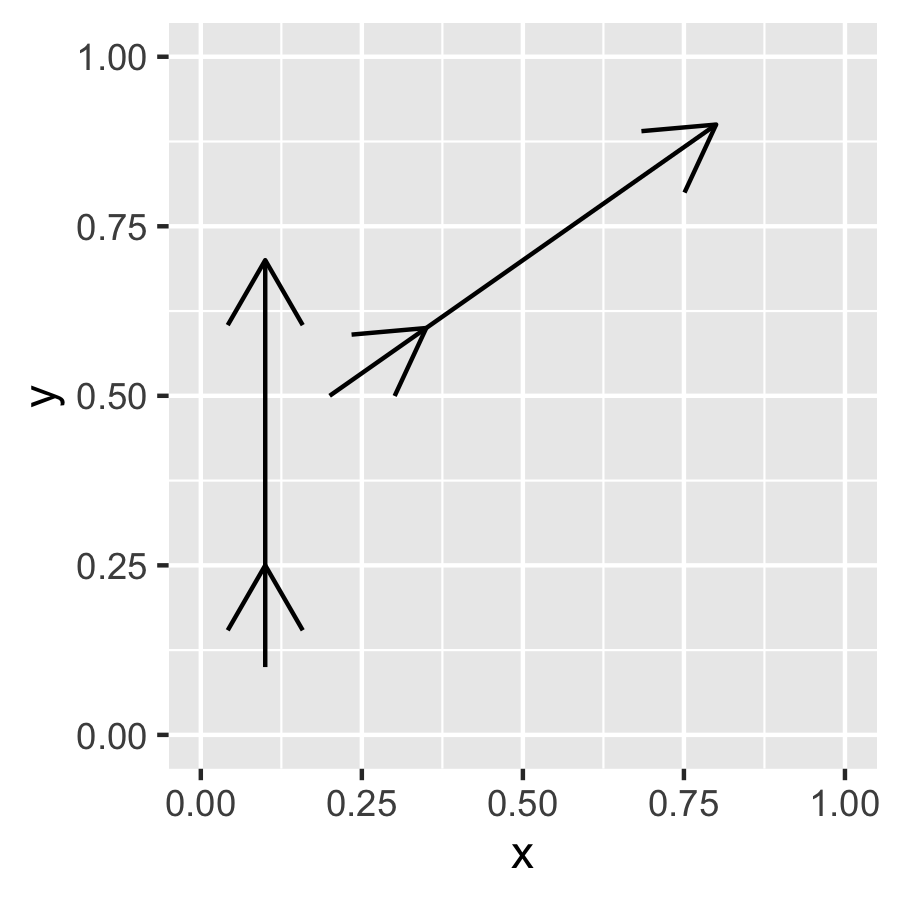
The look of each arrow can also be controlled separately by making
arrows a list:
ggplot(tbl) +
  geom_arrowsegment(aes(x = x, xend = xend, y = y, yend = yend),
                    arrow_positions = c(0.25, 1),
                    arrows = list(arrow(angle = 10),
                                  arrow(type = 'closed')))  +
  xlim(c(0,1)) +
  ylim(c(0,1))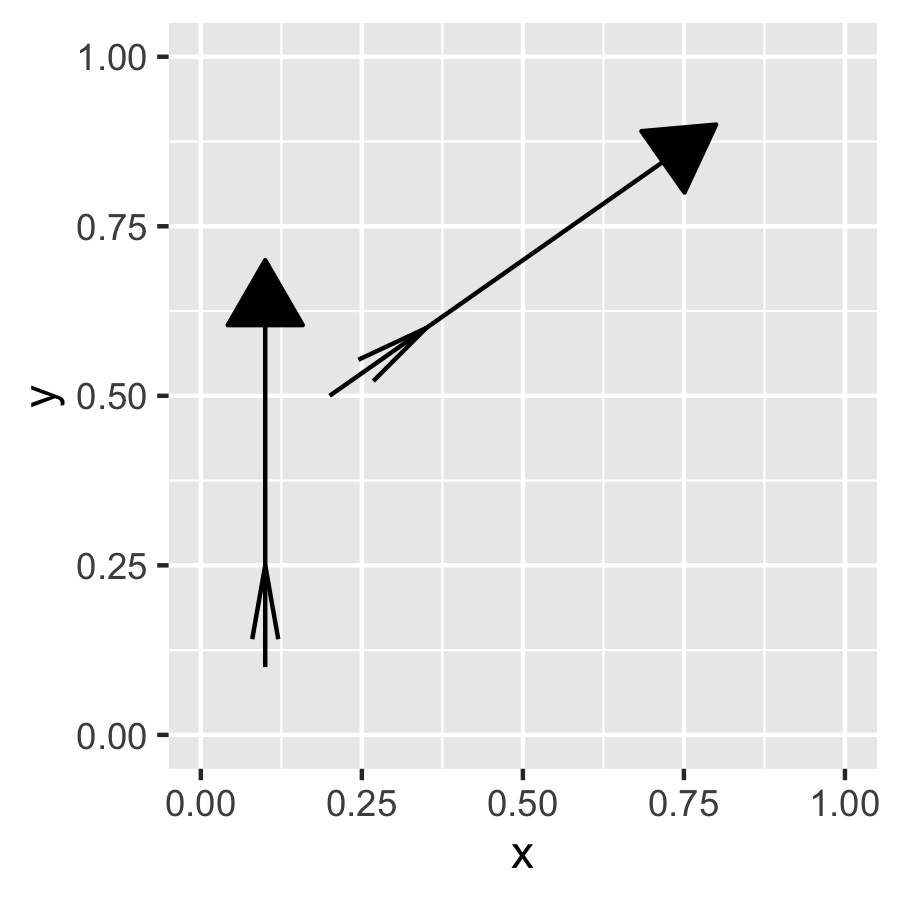
The arrow_fills option also mimics
arrow.fill of geom_segment() but can be a
vector. As with a specification of fill outside the
aesthetics, this takes precedence over a fill
aesthetic.
ggplot(tbl) +
  geom_arrowsegment(aes(x = x, xend = xend, y = y, yend = yend),
                    arrow_positions = c(0.25, 1),
                    arrow_fills = c("indianred3", "dodgerblue3"),
                    arrows = arrow(type = "closed"))  +
  xlim(c(0,1)) +
  ylim(c(0,1))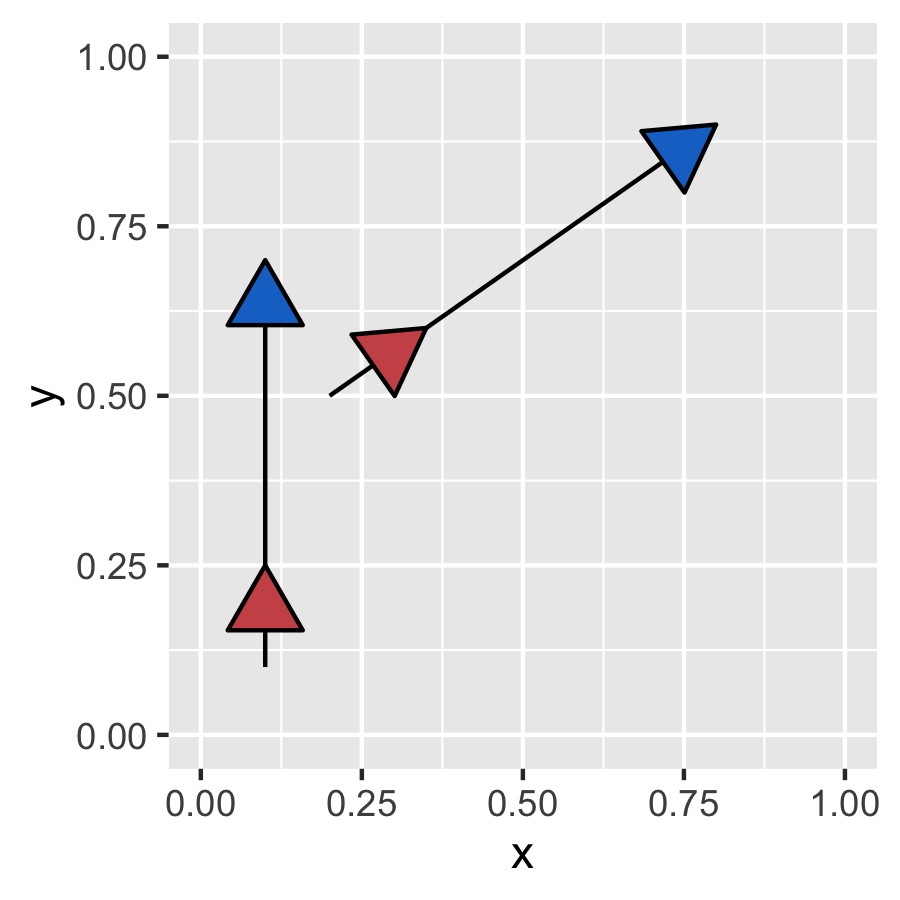
Finally, the geom can be used as an annotation:
ggplot(mtcars) +
  geom_point(aes(x = disp, y=hp)) +
  annotate(geom = "arrowsegment",
           x = 170,
           y=200,
           xend = 145,
           yend = 175,
           arrow_positions = 0.6,
           arrows = arrow(type = "closed", length = unit(0.1, "inches")))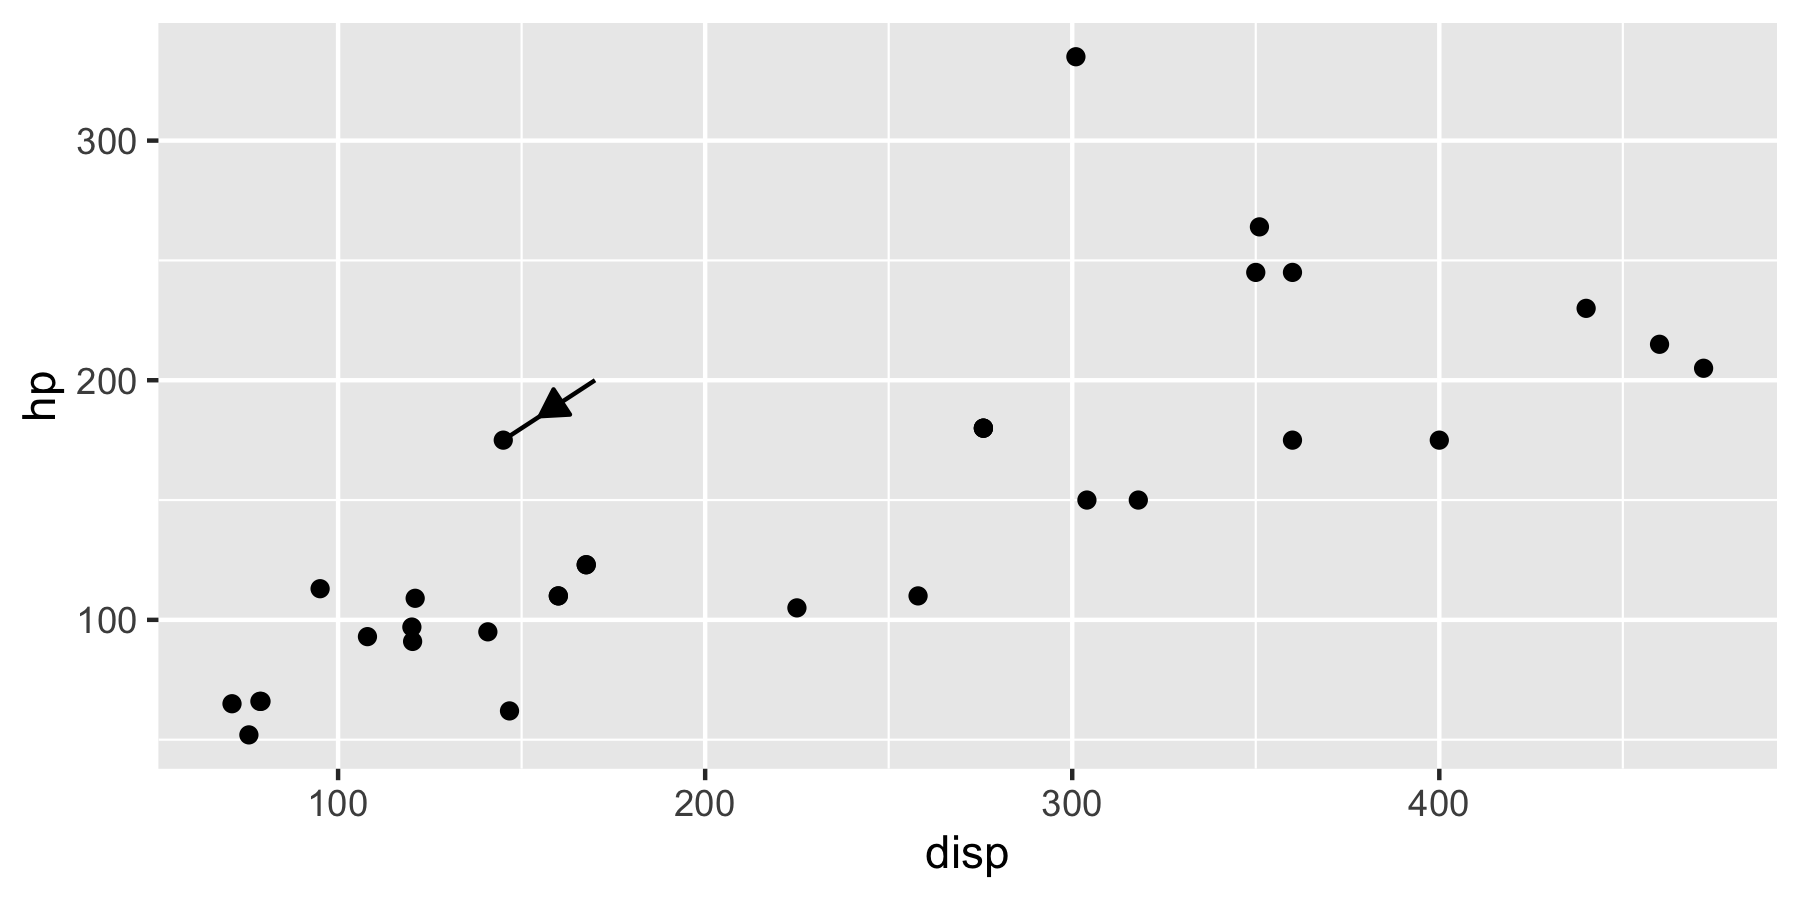
position_attractsegment()
allows you to automatically shave the ends of arrow segmentsposition_attractsegment() is intended to solve the
following problem. Suppose you have nicely laid out a set of labelled
points:
pt.tbl <- tibble(x = c(0.25, 0.5, 0.75), y = c(0.25, 0.5, 0.75), labels = c("A", "B", "C"))

ggplot(pt.tbl) +
  geom_point(aes(x,y, fill = labels), size =6, shape = 21) +
  geom_text(aes(x,y, label = labels)) +
  xlim(c(0, 1)) +
  ylim(c(0, 1)) +
  scale_fill_discrete(guide = "none")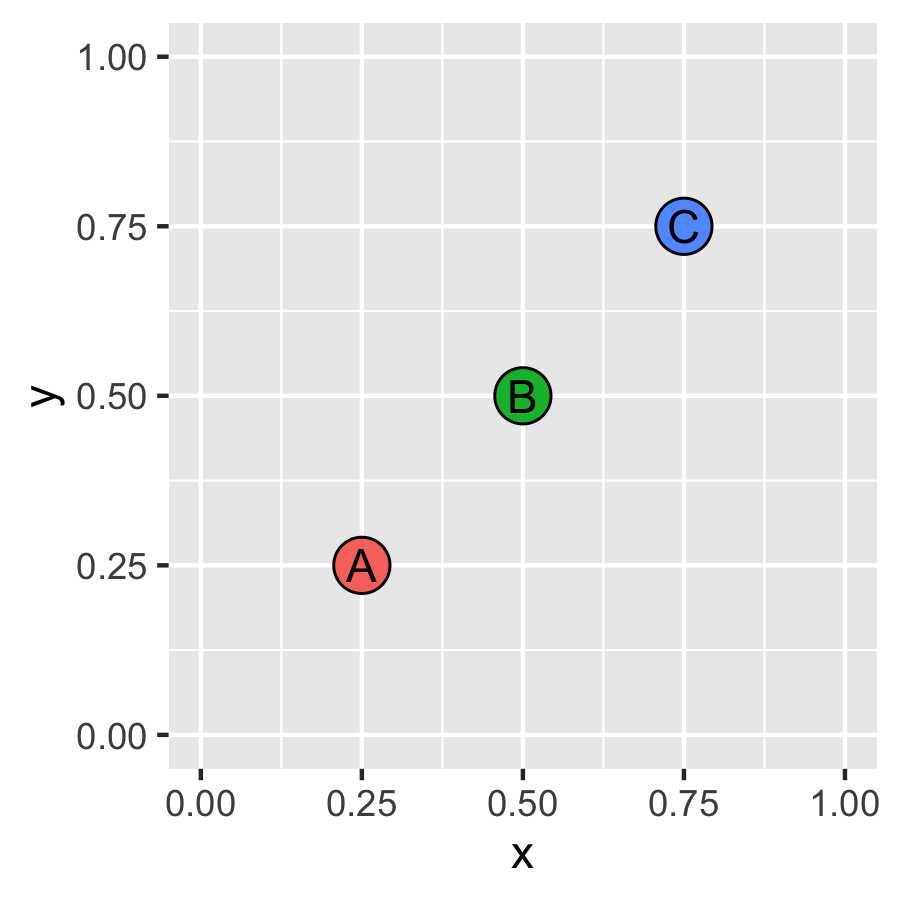
If you wish to connect these points using geom_segment()
with an arrow, the output is a little ugly, as the lines intersect the
points:
sg.tbl <- tibble(x = c(0.25, 0.5), y = c(0.25, 0.5), xend = c(0.5, 0.75), yend = c(0.5, 0.75))

ggplot(pt.tbl) +
  geom_point(aes(x,y, fill = labels), size =6, shape = 21) +
  geom_text(aes(x,y, label = labels)) +
  geom_segment(data = sg.tbl,
               aes(x = x, xend = xend, y = y, yend = yend),
               arrow = arrow()) +
  xlim(c(0, 1)) +
  ylim(c(0, 1)) +
  scale_fill_discrete(guide = "none")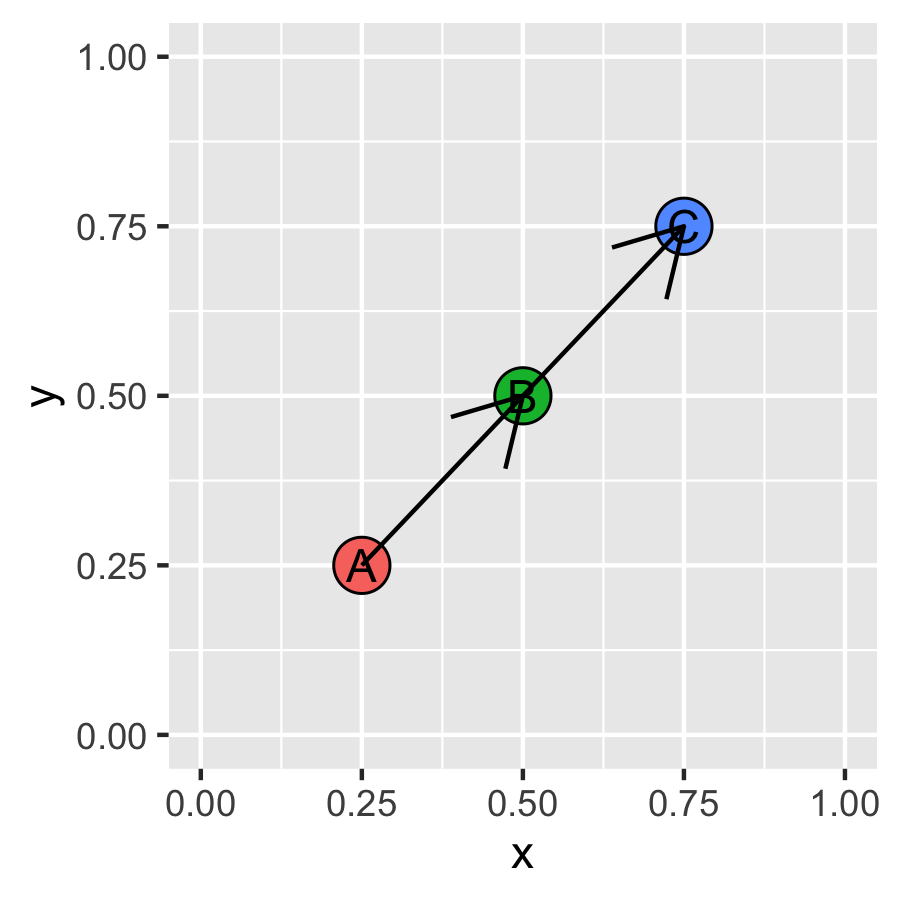
position_attractsegment() works by shortening the
segment at the start and the end (“attracting” the start and end points
towards each other). It can do this in two ways, as determined by the
type_shave option. If
type_shave = "proportion" (the default), then it takes the
proportions start_shave and end_shave
away:
ggplot(pt.tbl) +
  geom_point(aes(x,y, fill = labels), size =6, shape = 21) +
  geom_text(aes(x,y, label = labels)) +
  geom_segment(data = sg.tbl,
               aes(x = x, xend = xend, y = y, yend = yend),
               arrow = arrow(),
               position = position_attractsegment(start_shave = 0.1,
                                                  end_shave = 0.1)) +
  xlim(c(0, 1)) +
  ylim(c(0, 1)) +
  scale_fill_discrete(guide = "none")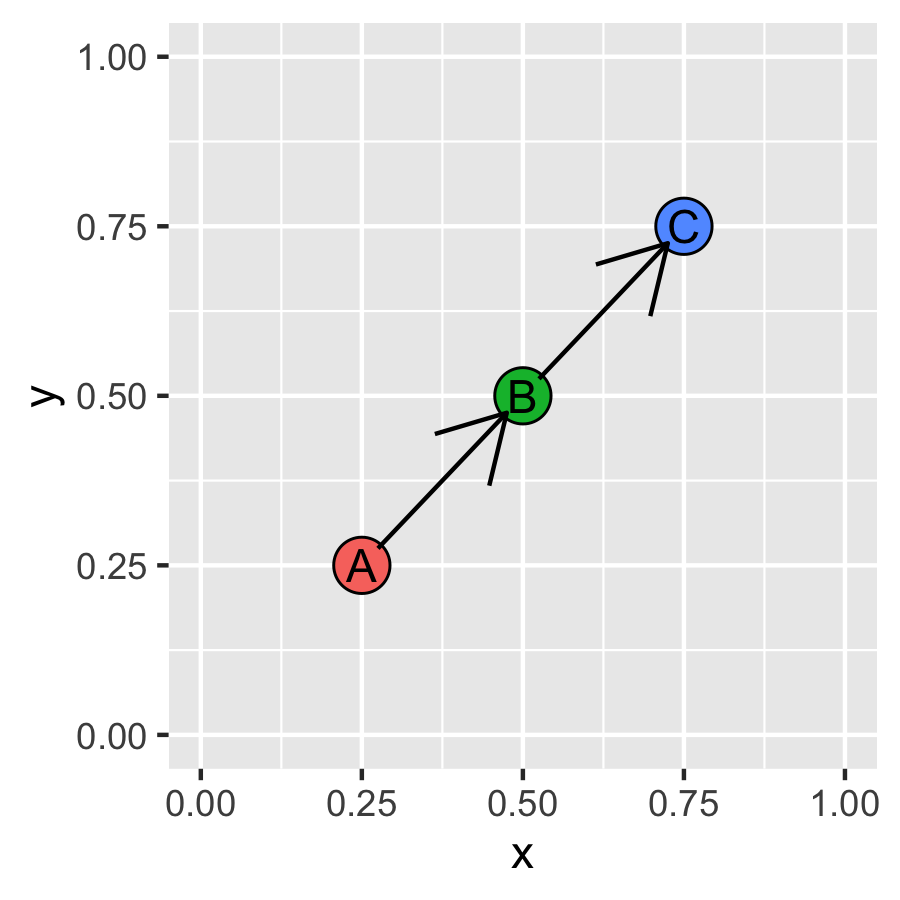
Alternatively, if type_shave = "distance" then the
amount removed is in graph units. This allows for finer control, but has
strange effects if the dimensions of the x and y axes are not the same
and is only really recommended in combination with
coord_fixed().
ggplot(pt.tbl)+
  geom_segment(data = sg.tbl, aes(x = x, xend = xend, y = y, yend = yend), arrow = arrow(),
               position = position_attractsegment(start_shave = 0,
                                                  end_shave = 0.05,
                                                  type_shave = "distance")) +
  geom_point(aes(x,y, fill = labels), size =6, shape = 21) +
  geom_text(aes(x,y, label = labels))  +
  xlim(c(0, 1)) +
  ylim(c(0, 1)) +
  scale_fill_discrete(guide = "none") +
  coord_fixed()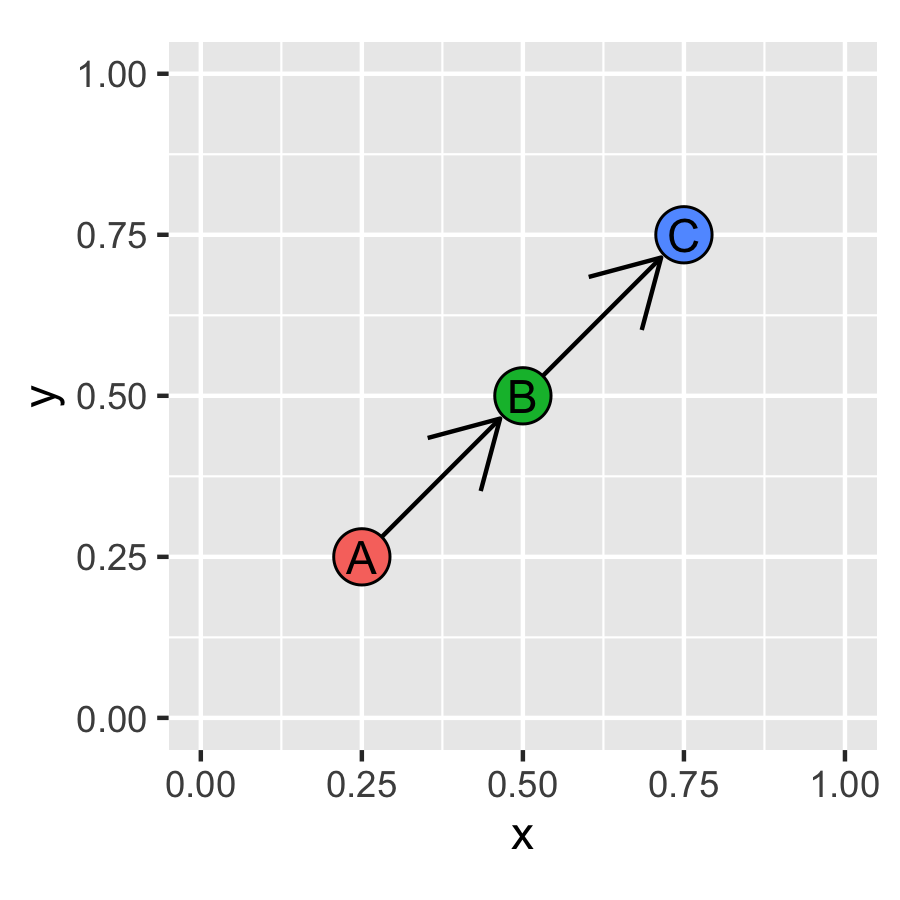
(Note here we shaved only the end of the segment, and drew the segment first.)
geom_arrowsegment() and
position_attractsegment() can naturally be used in
combination:
ggplot(pt.tbl)+
  geom_arrowsegment(data = sg.tbl, aes(x = x, xend = xend, y = y, yend = yend),
                    arrow_positions = c(0.5, 0.6),
                    arrows = arrow(length = unit(0.1, "inches")),
                    position = position_attractsegment(start_shave = 0.05,
                                                       end_shave = 0.05,
                                                       type_shave = "distance")) +
  geom_point(aes(x,y, fill = labels), size =6, shape = 21) +
  geom_text(aes(x,y, label = labels))  +
  xlim(c(0, 1)) +
  ylim(c(0, 1)) +
  scale_fill_discrete(guide = "none") +
  coord_fixed()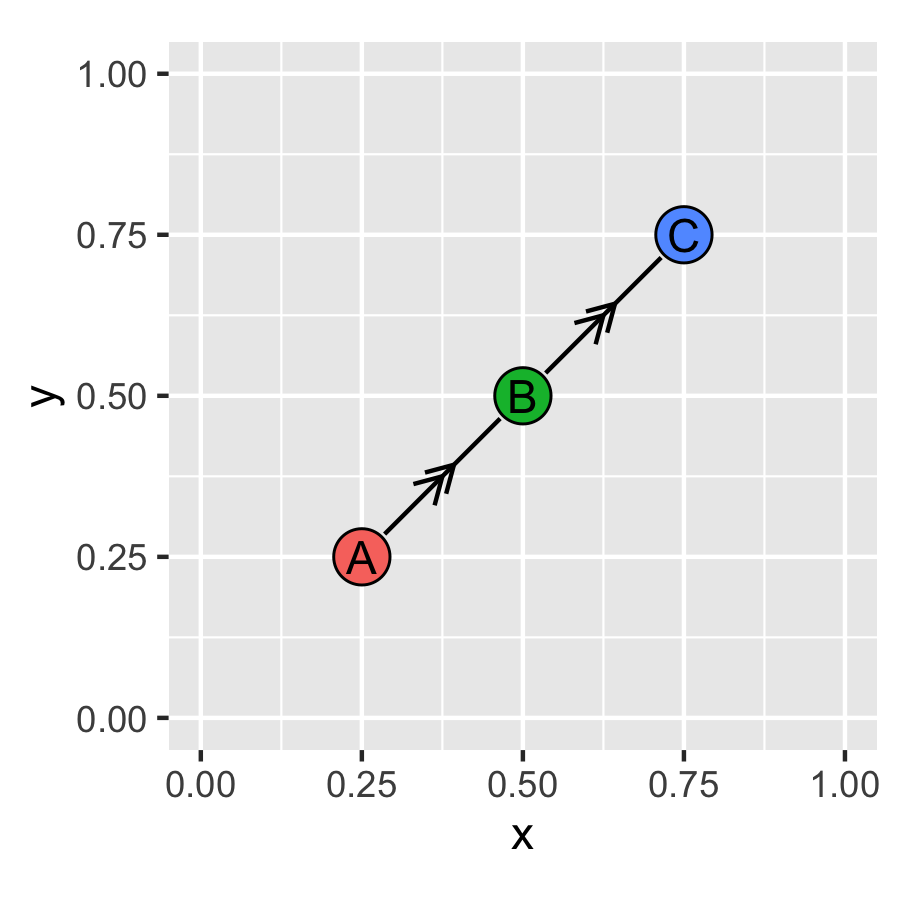
Current these replace only geom_segment() and work only
for linear coordinate systems. I would like to extend to
geom_curve() but the intricacies of
grid::curveGrob() make that much more complicated. Also the
fact that the specified arrow position corresponds to the arrowhead tip
can make lines look a little lopsided; it would be much better if the
specified point was the midpoint of the arrowhead instead, but this is
very difficult using grid::arrow() because of the units
specification. To do this I would probably need to draw my own
arrowheads. Maybe one day…
Next on my to-do list is extending to the geom_line()
and geom_path() parameterisations.