
Wajid Jawaid 2025-02-02
enrichR can be installed from Github or from CRAN.
library(devtools)
install_github("wjawaid/enrichR")The package can be downloaded from CRAN using:
install.packages("enrichR")enrichR provides an interface to the Enrichr database (Kuleshov et al. 2016) hosted at https://maayanlab.cloud/Enrichr/.
By default human genes are selected otherwise select your organism of choice. (This functionality was contributed by Alexander Blume)
library(enrichR)
#> Welcome to enrichR
#> Checking connections ...
#> Enrichr ... Connection is Live!
#> FlyEnrichr ... Connection is Live!
#> WormEnrichr ... Connection is Live!
#> YeastEnrichr ... Connection is Live!
#> FishEnrichr ... Connection is Live!
#> OxEnrichr ... Connection is Live!

listEnrichrSites()
#> Enrichr ... Connection is Live!
#> FlyEnrichr ... Connection is Live!
#> WormEnrichr ... Connection is Live!
#> YeastEnrichr ... Connection is Live!
#> FishEnrichr ... Connection is Live!
#> OxEnrichr ... Connection is Live!

setEnrichrSite("Enrichr") # Human genes
#> Connection changed to https://maayanlab.cloud/Enrichr/
#> Connection is Live!List all available databases from Enrichr.
dbs <- listEnrichrDbs()head(dbs)| geneCoverage | genesPerTerm | libraryName | numTerms | appyter | categoryId |
|---|---|---|---|---|---|
| 13362 | 275 | Genome_Browser_PWMs | 615 | ea115789fcbf12797fd692cec6df0ab4dbc79c6a | 1 |
| 27884 | 1284 | TRANSFAC_and_JASPAR_PWMs | 326 | 7d42eb43a64a4e3b20d721fc7148f685b53b6b30 | 1 |
| 6002 | 77 | Transcription_Factor_PPIs | 290 | 849f222220618e2599d925b6b51868cf1dab3763 | 1 |
| 47172 | 1370 | ChEA_2013 | 353 | 7ebe772afb55b63b41b79dd8d06ea0fdd9fa2630 | 7 |
| 47107 | 509 | Drug_Perturbations_from_GEO_2014 | 701 | ad270a6876534b7cb063e004289dcd4d3164f342 | 7 |
| 21493 | 3713 | ENCODE_TF_ChIP-seq_2014 | 498 | 497787ebc418d308045efb63b8586f10c526af51 | 7 |
Select the 2023 GO databases.
dbs <- c("GO_Molecular_Function_2023", "GO_Cellular_Component_2023",
"GO_Biological_Process_2023")Query with enrichr() using example genes available from
the package.
# Load example input genes
data(input)
length(input)
#> [1] 375
head(input)
#> [1] "Nsun3"    "Polrmt"   "Nlrx1"    "Sfxn5"    "Zc3h12c"  "Slc25a39"

enriched <- enrichr(input, dbs)
#> Uploading data to Enrichr... Done.
#>   Querying GO_Molecular_Function_2023... Done.
#>   Querying GO_Cellular_Component_2023... Done.
#>   Querying GO_Biological_Process_2023... Done.
#> Parsing results... Done.
Now view the "GO_Biological_Process_2023" results from
the enriched object.
head(enriched[["GO_Biological_Process_2023"]])| Term | Overlap | P.value | Adjusted.P.value | Old.P.value | Old.Adjusted.P.value | Odds.Ratio | Combined.Score | Genes |
|---|---|---|---|---|---|---|---|---|
| Mitochondrial Transcription (GO:0006390) | 3/12 | 0.0012685 | 0.7123925 | 0 | 0 | 17.577061 | 117.23788 | TFAM;POLRMT;TFB1M |
| Alpha-Amino Acid Metabolic Process (GO:1901605) | 4/29 | 0.0019937 | 0.7123925 | 0 | 0 | 8.452830 | 52.55773 | SRR;ALDH6A1;KMO;GNMT |
| Protein Transmembrane Import Into Intracellular Organelle (GO:0044743) | 4/32 | 0.0028882 | 0.7123925 | 0 | 0 | 7.546015 | 44.12249 | DNAJC19;TIMM44;TRIM37;PEX1 |
| Neutrophil Degranulation (GO:0043312) | 2/5 | 0.0033774 | 0.7123925 | 0 | 0 | 35.070599 | 199.57464 | VAMP8;STXBP2 |
| Medium-Chain Fatty Acid Biosynthetic Process (GO:0051792) | 2/5 | 0.0033774 | 0.7123925 | 0 | 0 | 35.070599 | 199.57464 | ABHD3;OXSM |
| Mitochondrial RNA Metabolic Process (GO:0000959) | 3/20 | 0.0058819 | 0.7123925 | 0 | 0 | 9.301708 | 47.77237 | TFAM;POLRMT;TFB1M |
You can now add background genes when using
enrichr().
# Load example background
data(background)
length(background)
#> [1] 20625
head(background)
#> [1] "A1BG"     "A2M"      "NAT1"     "NAT2"     "SERPINA3" "AADAC"

enriched2 <- enrichr(input, dbs, background = background)
#> Uploading data to Speedrichr...
#>  - Your gene set... Done.
#>  - Your background... Done.
#> Getting enrichment results...
#>  - GO_Molecular_Function_2023... Done.
#>  - GO_Cellular_Component_2023... Done.
#>  - GO_Biological_Process_2023... Done.
#> Parsing results... Done.
Now view the "GO_Biological_Process_2023" results from
the enriched2 object.
head(enriched2[["GO_Biological_Process_2023"]])| Term | Rank | P.value | Adjusted.P.value | Old.P.value | Old.Adjusted.P.value | Odds.Ratio | Combined.Score | Genes |
|---|---|---|---|---|---|---|---|---|
| Mitochondrial Transcription (GO:0006390) | 1 | 0.0003711 | 0.240515 | 0 | 0 | 27.116000 | 214.19193 | TFAM;POLRMT;TFB1M |
| Alpha-Amino Acid Metabolic Process (GO:1901605) | 2 | 0.0004145 | 0.240515 | 0 | 0 | 13.057671 | 101.69976 | SRR;ALDH6A1;KMO;GNMT |
| Protein Transmembrane Import Into Intracellular Organelle (GO:0044743) | 3 | 0.0006097 | 0.240515 | 0 | 0 | 11.656913 | 86.29136 | DNAJC19;TIMM44;TRIM37;PEX1 |
| Monocarboxylic Acid Biosynthetic Process (GO:0072330) | 4 | 0.0012176 | 0.240515 | 0 | 0 | 6.816532 | 45.74506 | ALDH1A3;SRR;SCP2;OXSM;MCAT |
| Neutrophil Degranulation (GO:0043312) | 5 | 0.0014663 | 0.240515 | 0 | 0 | 54.031872 | 352.55862 | VAMP8;STXBP2 |
| Medium-Chain Fatty Acid Biosynthetic Process (GO:0051792) | 6 | 0.0014663 | 0.240515 | 0 | 0 | 54.031872 | 352.55862 | ABHD3;OXSM |
By default, the results table from analysis with a background does
not have the ‘Overlap’ column. We can calculate the annotated genes in
each term from GMT files and replace the ‘Rank’ column with ‘Overlap’ by
setting include_overlap = TRUE.
enriched3 <- enrichr(input, dbs, background = background, include_overlap = TRUE)
#> Uploading data to Speedrichr...
#>  - Your gene set... Done.
#>  - Your background... Done.
#> Getting enrichment results...
#>  - GO_Molecular_Function_2023... Done.
#>    - Download GMT file... Done.
#>  - GO_Cellular_Component_2023... Done.
#>    - Download GMT file... Done.
#>  - GO_Biological_Process_2023... Done.
#>    - Download GMT file... Done.
#> Parsing results... Done.
Now view the "GO_Biological_Process_2023" results from
the enriched3 object.
head(enriched3[["GO_Biological_Process_2023"]])| Term | Overlap | P.value | Adjusted.P.value | Old.P.value | Old.Adjusted.P.value | Odds.Ratio | Combined.Score | Genes |
|---|---|---|---|---|---|---|---|---|
| Mitochondrial Transcription (GO:0006390) | 3/12 | 0.0003711 | 0.240515 | 0 | 0 | 27.116000 | 214.19193 | TFAM;POLRMT;TFB1M |
| Alpha-Amino Acid Metabolic Process (GO:1901605) | 4/29 | 0.0004145 | 0.240515 | 0 | 0 | 13.057671 | 101.69976 | SRR;ALDH6A1;KMO;GNMT |
| Protein Transmembrane Import Into Intracellular Organelle (GO:0044743) | 4/32 | 0.0006097 | 0.240515 | 0 | 0 | 11.656913 | 86.29136 | DNAJC19;TIMM44;TRIM37;PEX1 |
| Monocarboxylic Acid Biosynthetic Process (GO:0072330) | 5/65 | 0.0012176 | 0.240515 | 0 | 0 | 6.816532 | 45.74506 | ALDH1A3;SRR;SCP2;OXSM;MCAT |
| Neutrophil Degranulation (GO:0043312) | 2/5 | 0.0014663 | 0.240515 | 0 | 0 | 54.031872 | 352.55862 | VAMP8;STXBP2 |
| Medium-Chain Fatty Acid Biosynthetic Process (GO:0051792) | 2/5 | 0.0014663 | 0.240515 | 0 | 0 | 54.031872 | 352.55862 | ABHD3;OXSM |
Plot the "GO_Biological_Process_2023" results. (Plotting
function contributed by I-Hsuan Lin)
plotEnrich(enriched[["GO_Biological_Process_2023"]], showTerms = 20, numChar = 40,
       y = "Count", orderBy = "P.value")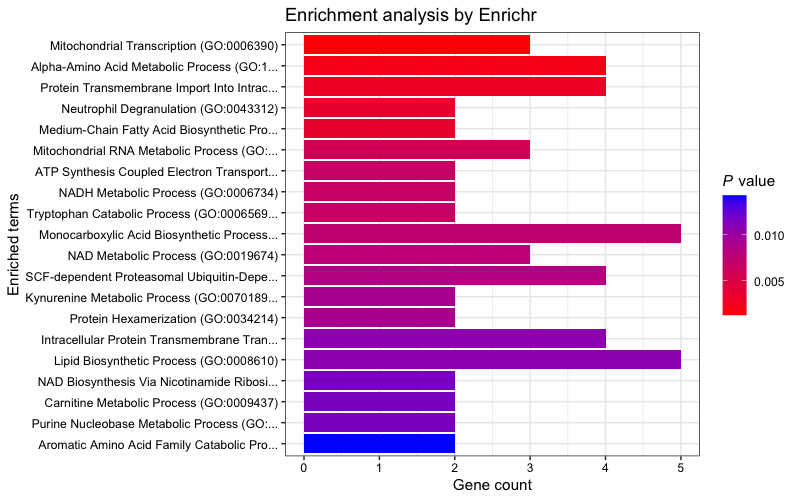
Export Enrichr results as text or Excel files. By default
(i.e. outFile = "txt"), the results from all the selected
databases are saved into individual text files. When using
outFile = "excel", the results are saved into worksheets in
a single Excel 2007 (XLSX) file. (Print function contributed by I-Hsuan
Lin and Kai Hu)
# To text files
printEnrich(enriched)

# To Excel
printEnrich(enriched, outFile = "excel")enrichR behind
a proxyIf your computer is behind an HTTP or HTTPS proxy, you can set the
RCurl Proxy options explicitly using RCurlOptions and
enrichR will use the provided settings to connect to the Enrichr
database via httr::use_proxy().
For example:
options(RCurlOptions = list(proxy = 'http://ip_or_url',
                            proxyusername = 'myuser',
                            proxypassword = 'mypwd',
                            proxyport = 'port_num',
                            proxyauth = 'basic'))