
muschellij2 badges:

This in an R package for cleaning and some preliminary analysis of Coursera research data exports. The package helps import and organize all the tables in R. It also run some preliminary analysis on the data. Note that this package is still under development and the auther appreciates feedback and suggestions.
to install this package, you will need to install
devtools. Install the devtools package,
available from CRAN.
library("devtools")
devtools::install_github("jhudsl/crsra", build_vignettes = TRUE)Research on Massive Open Online Courses (MOOCs) is young.[1] studied literature published on MOOCs through 2015 and found that the number of articles published on the subject increased from 1 in 2008 to 170 in 2015. More research is needed to fully understand the effectiveness, reach, limits, and the potential of MOOCs. However, the main challenges in studying MOOCs remains to be data. Data on MOOCs are not usually publicly available since it is owned by private providers and there are concerns about the privacy of students. More importantly, as Lopez et. al[2] point out, the size and complexity of MOOC data is an overwhelming challenge to many researchers. Therefore, it is imperative to provide tools that pave the way for more research on the new subject of MOOCs.
This paper introduces a package called crsra based on
the statistical software R to help clean and analyze massive loads of
data from the Coursera MOOCs. Coursera is one of the leading providers
of MOOCs and was launched in January 2012. With over 25 million
learners, Coursera is the most popular provider in the world being
followed by EdX, the MOOC provider that was a result of a collaboration
between Harvard University and MIT, with over 10 million users. Coursera
has over 150 university partners from 29 countries and offers a total of
2000+ courses from computer science to philosophy.[3] Besides, Coursera
offers 180+ specialization, Coursera’s credential system, and four fully
online Masters degrees. A typical course on Coursera includes recorded
video lectures, graded assignment, quizzes, and discussion forums.
Since the early years of the company, Coursera has encouraged researchers to analyze students’ data and has facilitated the use of the data and the platform for A/B testing. Starting November 2015 Coursera introduced a dashboard for self-service data exports. Through this tool, partner institutions and instructors could download data for a single course or all courses associated with the institution. Research data exports are sets of CSV files and are designed for use in relational database systems. One of the advantages of the data is the existence of a single hashed user ID for each student. This user ID is consistent for learners across all courses offered by an individual institution and allows for connecting learner grades and progress across courses.
The advantages of the package are as follows:
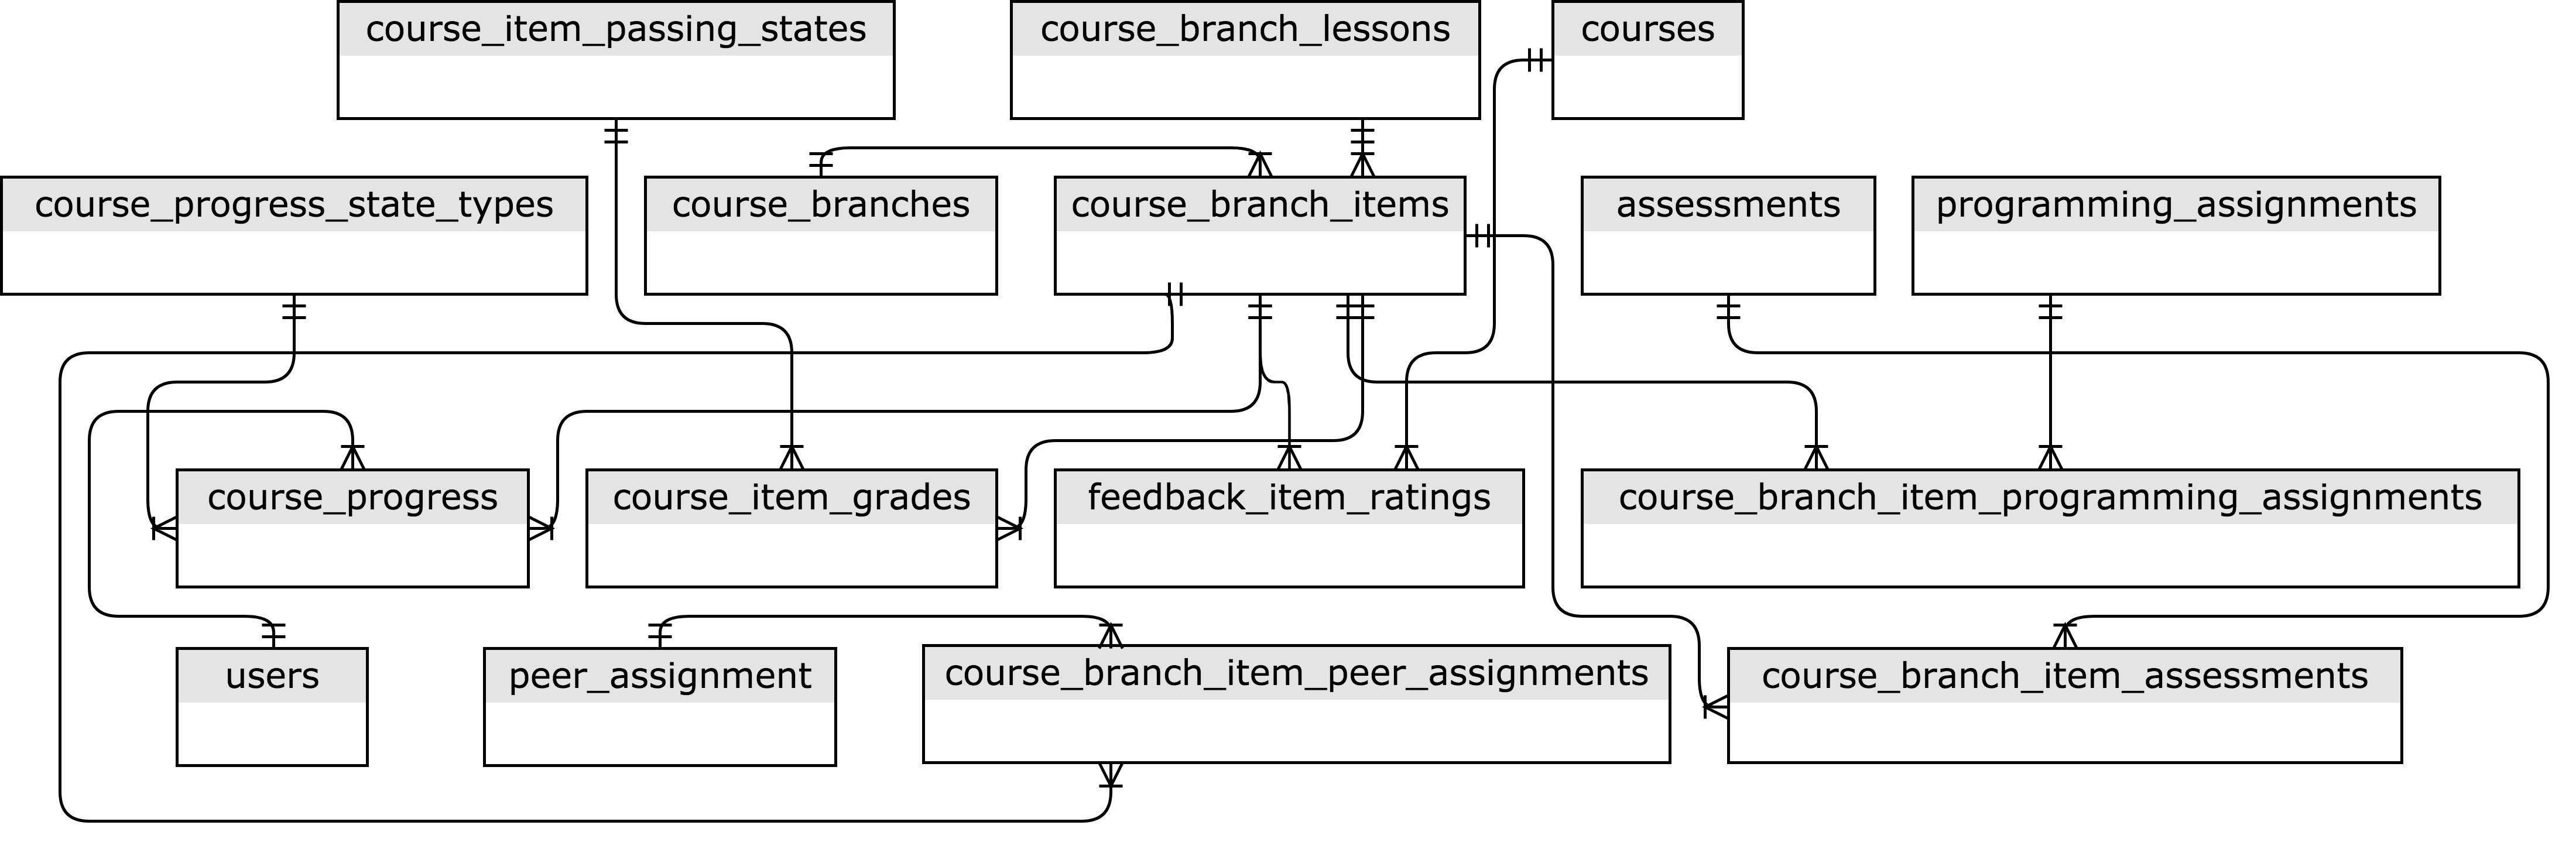
There are five types of research data export for each course. Table below summarizes these five types. The data are written in roughly 100 tables containing information such as course content, students’ demographic data, progress, and outcomes, and forum data.
| Data Type | Description |
|---|---|
| Assessment submission data | Assessment submissions of quizzes, peer review, and programming assignments by learners. |
| Course grade data | Contains the highest grade achieved by each learner on each required assessment as well as the time stamp of the learner’s highest-scoring submission. This table also includes each learner’s overall grade in the course. |
| Course progress data | Contains data documenting the time stamp for when the learner interacted with each piece of course content and the time stamps for when items were opened, completed, reopened, reattempted, etc. |
| Demographic data | Contains the following information for all enrolled learners: general geographical data (based on IP address), browser language preference, and information for learners who completed their learner profile responses or participated in Coursera’s platform-wide demographic survey (including age, gender, education level, and employment status). |
| Discussion data | Contains forum activity data such as posts, responses, upvotes/downvotes, flags, and questions and answers associated with course content items. |
Figure below shows different types of research data exports provided by Coursera.
While Coursera provides tools for creating PostgreSQL databases in a docker container,[5] as we mentioned earlier, importing data for analysis remains to be a challenge for researchers with limited experience with relational databases. Moreover, such tools are usually not platform independent.[6]
crsra PackageThe crsra package helps import and organize Coursera’s
research data exports into R. It also runs some preliminary analysis on
the data. In the following section, we introduce the package and provide
instruction on how to import Coursera research data exports. To install
this package, you can either directly install the package from CRAN by
install.packages("crsra") or install the development
version through devtools, then execute the following
commands:
library("devtools")
devtools::install_github("jhudsl/crsra", build_vignettes = TRUE)To import your data dump into R, you will first need to unzip your
data exports into one folder. There are two ways to import the data. You
can import all your courses at once by poining your working directoty to
the folder that contains all the unzipped folders as following. Then
execute the command crsra_import. Setting the
check_problems attribute to FALSE will turn off warnings
when importing the csv files.
my_import <- crsra_import(workdir = ".", check_problems = TRUE)A specific course within a course can be called as follows
user_table <- my_import[["Regression Models"]][["users"]]or in a pipe
library(dplyr)
user_table <- my_import %>%
    .[["Regression Models"]] %>%
    .[["users"]]
A second method is to import an individual course. For this type of import unzip the data export for the course and set your working directly to the folder that contains all the csv tables.
my_course_import <- crsra_import_course(workdir = ".", check_problems = TRUE)Calling a table is a little different in this method since the imported data only contains one course. To call a table execute
user_table_2 <- my_course_import[["users"]]or in a pipe
library(dplyr)
user_table_2 <- my_course_import %>%
    .[["users"]]
You can also dowanload the dummy data included in the
inst/extdata folder in the package source codes. If you are
not pointing to the correct directory, you will receive a warning, and
the execution will be halted. Note that the data import may take some
time if the course data is large and there are several courses in your
working directory.
To see the data import in use, we use the package on data from Johns
Hopkins University (JHU) Data Science Specialization on Coursera. This
specialization, developed by Jeffrey Leek, Roger Peng, and Brian Caffo,
consists of ten courses. There have been more than two million
enrollments since the launch of this program in April 2014. The size of
data on the students who took these ten courses since 2015 is around 18
gigabytes. In the following example, we use the crsra
package to import a Coursera data dump at our disposal on all the
courses and to find the number of students who passed a specific course
item (course item 67c1O) in the course “Regression
Models.”
my_import %>%
    .[["Regression Models"]] %>%
    .[["course_item_grades"]] %>%
    filter(course_item_id == "67c1O") %>%
    filter(course_item_passing_state_id == 2) %>%
    summarise(n = n())

# A tibble: 1 x 1
#      n
#   <int>
# 1 8640The package also includes a few other functions in addition to the
main crsra_import() function. A list of functions and their
descriptions is provided in the table below.
| Function | Description |
|---|---|
crsra_membershares |
Returns a summary of the total number and the shares of users in each course broken down by factors such as roles, country, language, gender, employment status, education level, and student status. |
crsra_gradesummary |
Returns total grade summary broken down by the factors mentioned above. |
crsra_progress |
Summarizes, for each course item, the total number and the share of users who ceased activity at that specific course item. The function ranks course items by their attrition. |
crsra_assessmentskips |
Users may “skip” reviewing a peer-assessed submission if there is a problem with it. This function categorizes skips by their type such as “inappropriate content”, “plagiarism”, etc. The function also returns a word cloud appeared in peer comments as to why they skipped the submission. |
crsra_timetofinish |
Calculates the time to finish a course for each user |
crsra_anonymize |
Anonymizes the list of columns passed to the function given an algorithm (default is “crc32”) |
crsra_deleter_user |
Deletes a specific user from all the tables. |
crsra_tabledesc |
Provides the description of the table passed to the function |
crsra_whichtable |
Returns a list of tables that include the variable passed to the function |
Similar to the example above, we can use the function
crsra_gradesummary() to calculate the average student grade
for the courses in the data import. By using the argument
groupby we can calculate average grades for different
learner subgroups based on gender, education, student status, employment
status, and country. For instance, the following analysis returns the
average overall course grade for male and female learners in the course
The Data Scientist’s Toolbox. The results show that female
learners’ grades are on average 6 points lower on a 100 scale than male
learners’ grades.
crsra_gradesummary(my_import, groupby = "gender") %>%
    .[["Regression Models"]]

#Note that maximum grade possible is 1.
# A tibble: 2 x 2
#  reported_or_inferred_gender  AvgGrade
#                        <chr>     <dbl>
#1                        male 0.7250660
#2 female 0.6691554The existence of fundamental differences between traditional education and MOOCs has attracted a new wave of studies on students’ behavior and outcomes in the online world. These differences are best reflected in the definition of MOOCs by McAuley et al.[7] that “[a]n online course with the option of free and open registration, a publicly shared curriculum, and open-ended outcomes which integrates social networking, accessible online resources … and most significantly builds on the engagement of learners who self-organize their participation according to learning goals, prior knowledge and skills, and common interests.” Such differences require further research on MOOCs. Understanding how students progress through an education program is critical for any educational planning and decision making.[8] Models of student progress are needed to estimate the probability of a student completing a particular item in a course and predict the time required to finish a course. Furthermore, conventional measures of academic success and progress cannot be defined in the same way for MOOCs. For instance, as Perna et al.[9] state, we have limited knowledge on whether learners’ progress through a MOOC should be measured in a sequential fashion or in a way that captures the flexibility and freedom in learning behavior that is unique to MOOCs.
There are only a handful of studies on students’ progress and outcomes in MOOCs. Perna et al. perform a descriptive analysis of student progress through a set of 16 courses on Coursera. They found that most users accessed course content in the sequential order defined by the instructor of the course. Ho et al.[10] study 17 courses taught on EdX and found that most of the attrition in online courses happen in the first week of course activity (about 50 percent attrition) and that the average percentage of learners who cease activity in the second week declines sharply to 16 percent. Most of these studies are specific to a set of courses or platforms. Due to the many differences in the characteristics of MOOCs, any extrapolation of the results to MOOCs in general has to be done with caution.
In the following section, we will investigate students’ progress
through the ten Data Science Specialization courses on Coursera provided
by JHU. Using the crsra_timetofinish function in the
crsra package, we can first investigate the time difference
between the first and last activities in a course for each student. Time
to finish is only calculated for those who completed the course. Figure
below depicts the density plot for time to complete for three of the
courses in the specialization. Note that the density plot varies across
courses. While for Developing Data Products and Getting and
Cleaning Data a majority of students finish the courses in around
30 days, for Data Science Capstone a majority of students
finish the course in 50 days.
ttf <- crsra_timetofinish(my_import)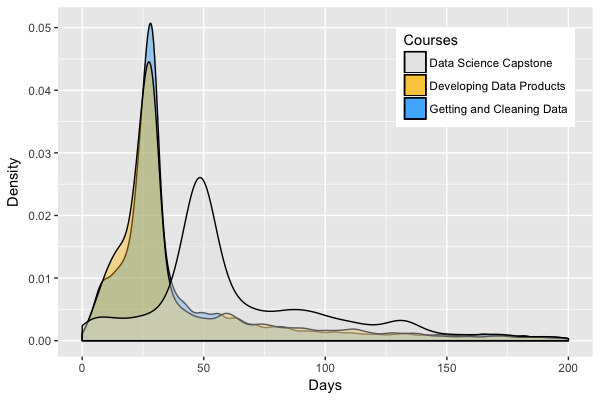
If you have any questions or feedback, please report any issues or bugs.
License: GPL-2
To cite crsra, please use: Aboozar Hadavand, Jeff T Leek, and John Muschelli (2018). crsra: A Package for Tidying and Analyzing ‘Coursera’ Research Export Data. https://github.com/jhudsl/crsra
Bozkurt, Aras, Ela Akgün-Özbek, and Olaf Zawacki-Richter. “Trends and patterns in massive open online courses: Review and content analysis of research on MOOCs (2008-2015).” The International Review of Research in Open and Distributed Learning 18.5 (2017).
Lopez, Glenn, et al. “Google BigQuery for Education: Framework for Parsing and Analyzing edX MOOC Data.” Proceedings of the Fourth
https://blog.coursera.org/about/, Accessed: 2018-02-02
Reich, Justin. “Rebooting MOOC research.” Science 347.6217 (2015): 34-35.
The tool is called courseraresearchexports and can
be found at https://github.com/coursera/courseraresearchexports
In an initial version of crsra based on PostgreSQL,
we had the problem of some team members not being able to set up the
database correctly on their PCs.
McAuley, Alexander, et al. “The MOOC model for digital practice.” (2010).
King, Mervyn A. Primary and secondary indicators of education. Department of Applied Economics, University of Cambridge, 1972.
Perna, Laura W., et al. “Moving through MOOCs: Understanding the progression of users in massive open online courses.” Educational Researcher 43.9 (2014): 421-432.
Ho, Andrew Dean, et al. “HarvardX and MITx: The first year of open online courses, fall 2012-summer 2013.” (2014).