![]()
![]()
![]()
![]()
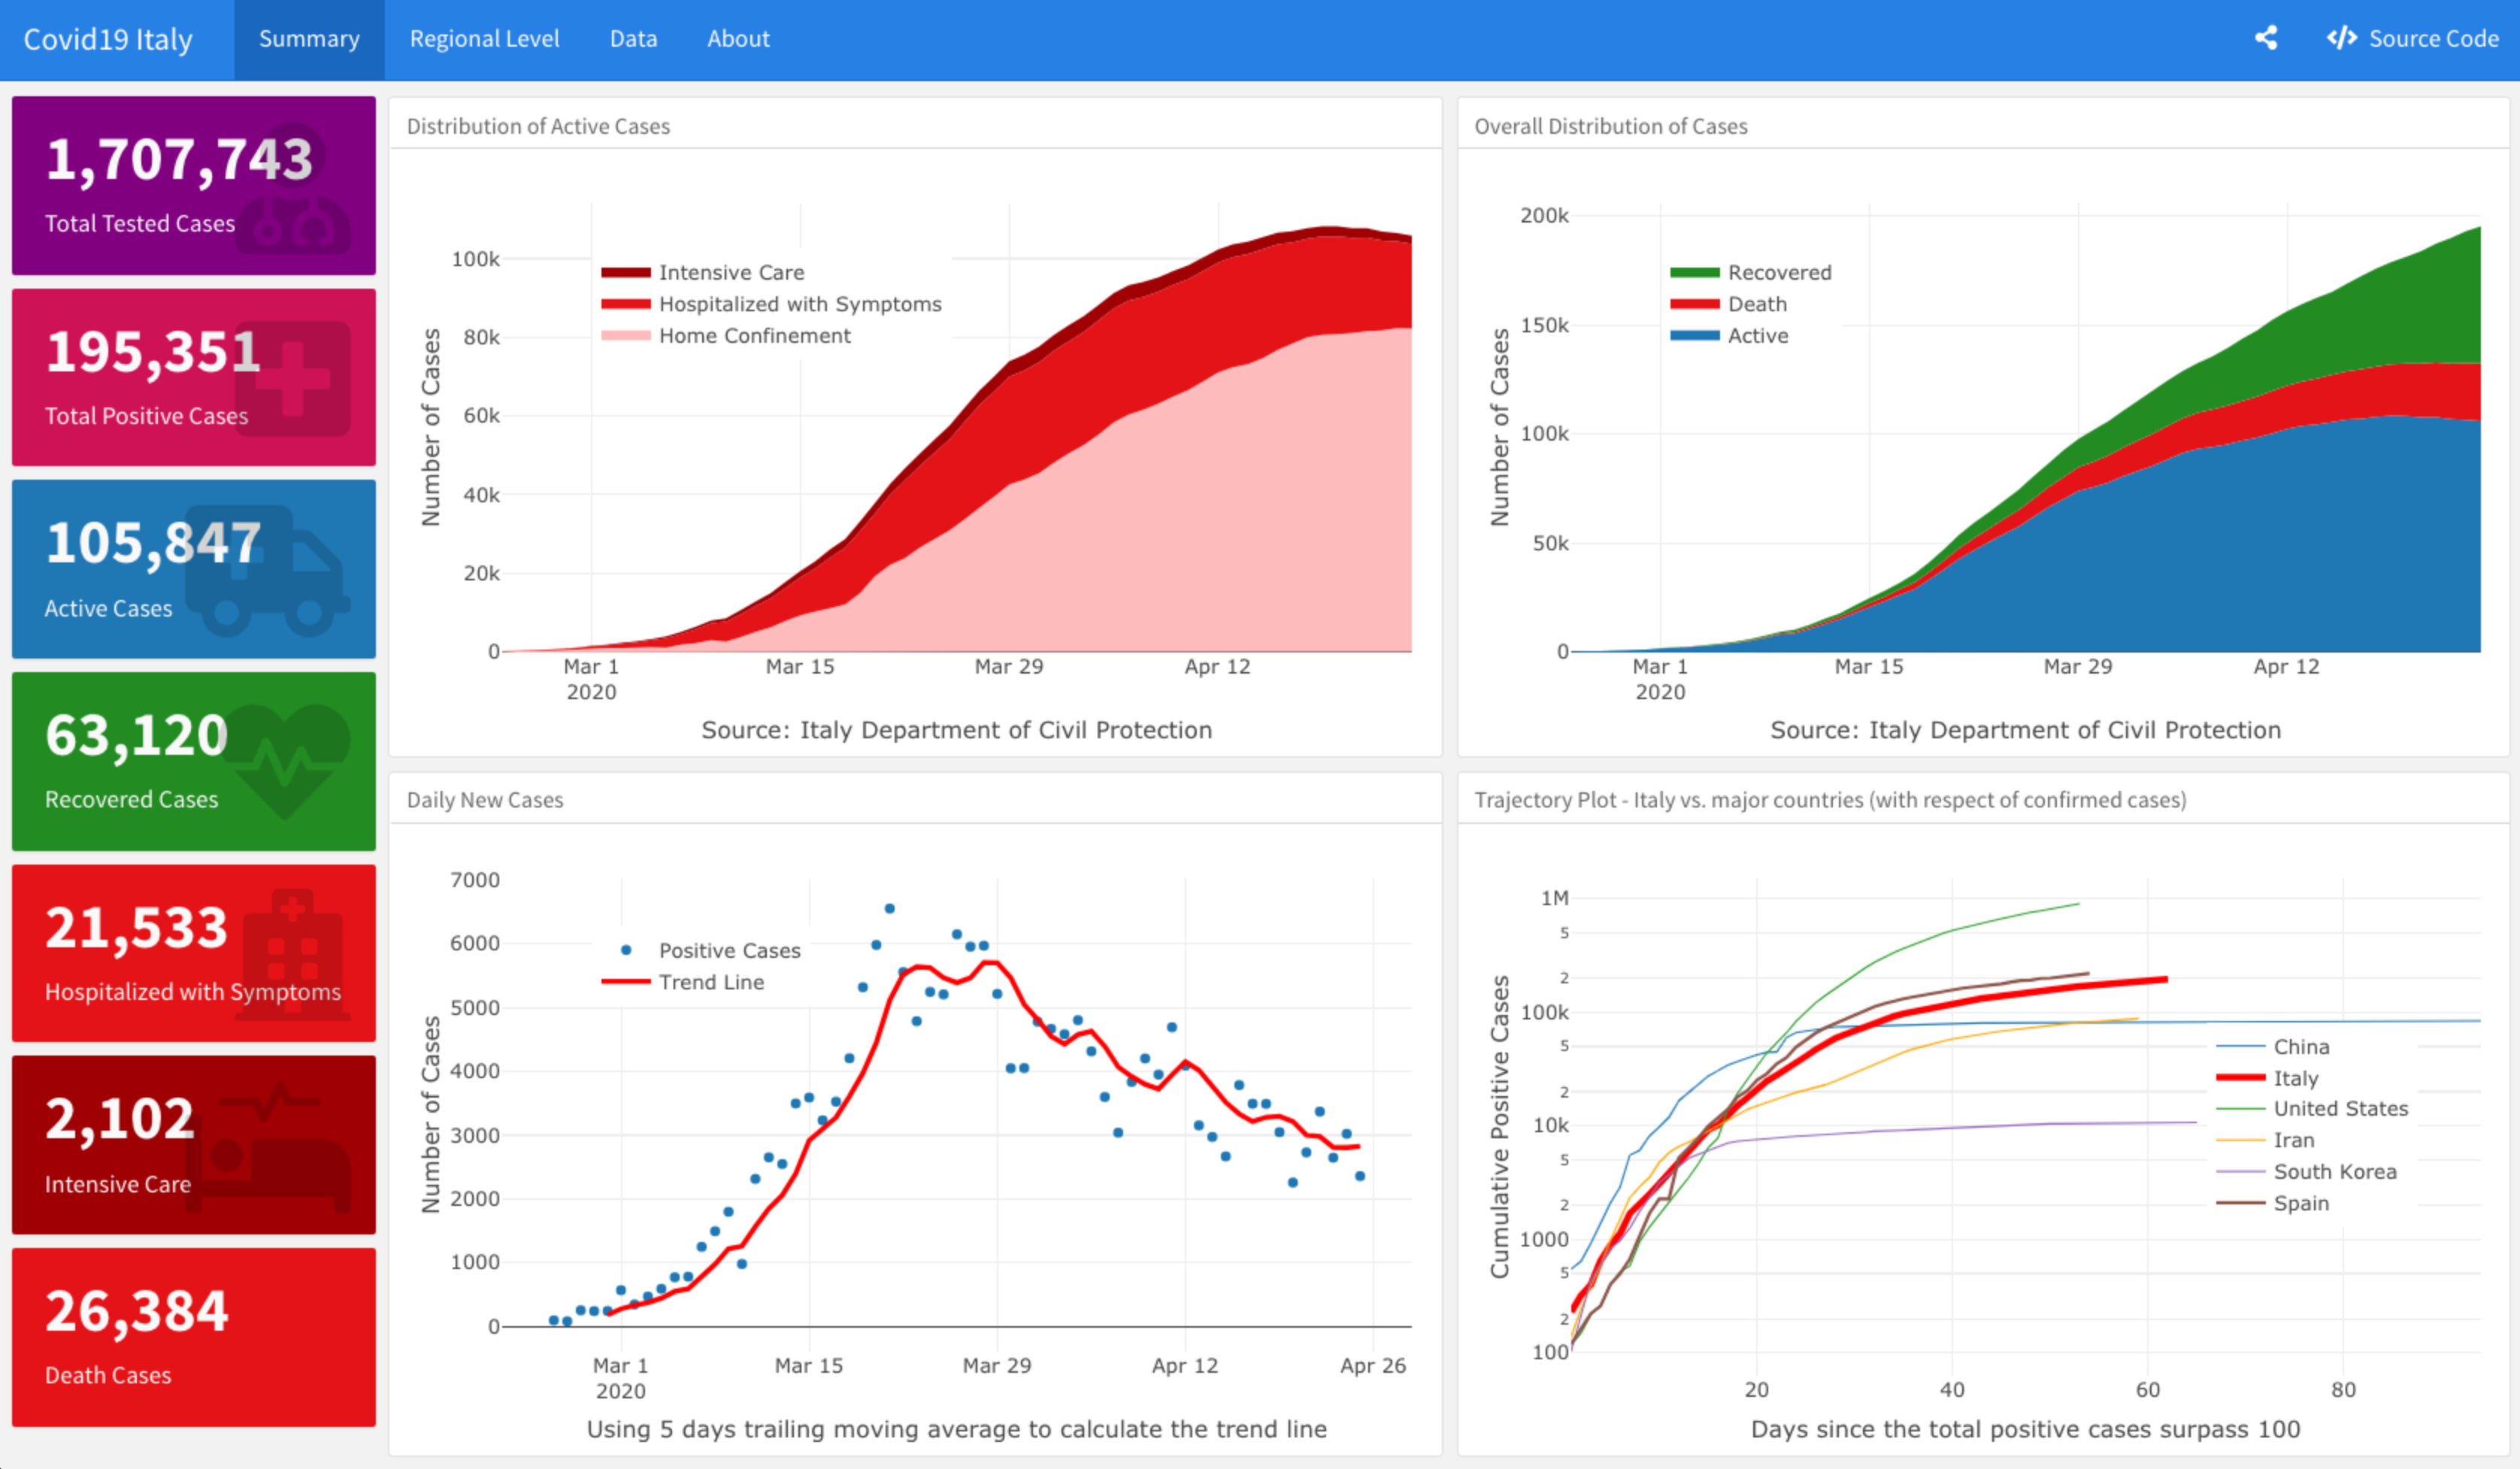
The covid19italy R package provides a tidy format dataset of the 2019 Novel Coronavirus COVID-19 (2019-nCoV) pandemic outbreak in Italy. The package includes the following three datasets:
italy_total - daily summary of the outbreak on the
national levelitaly_region - daily summary of the outbreak on the
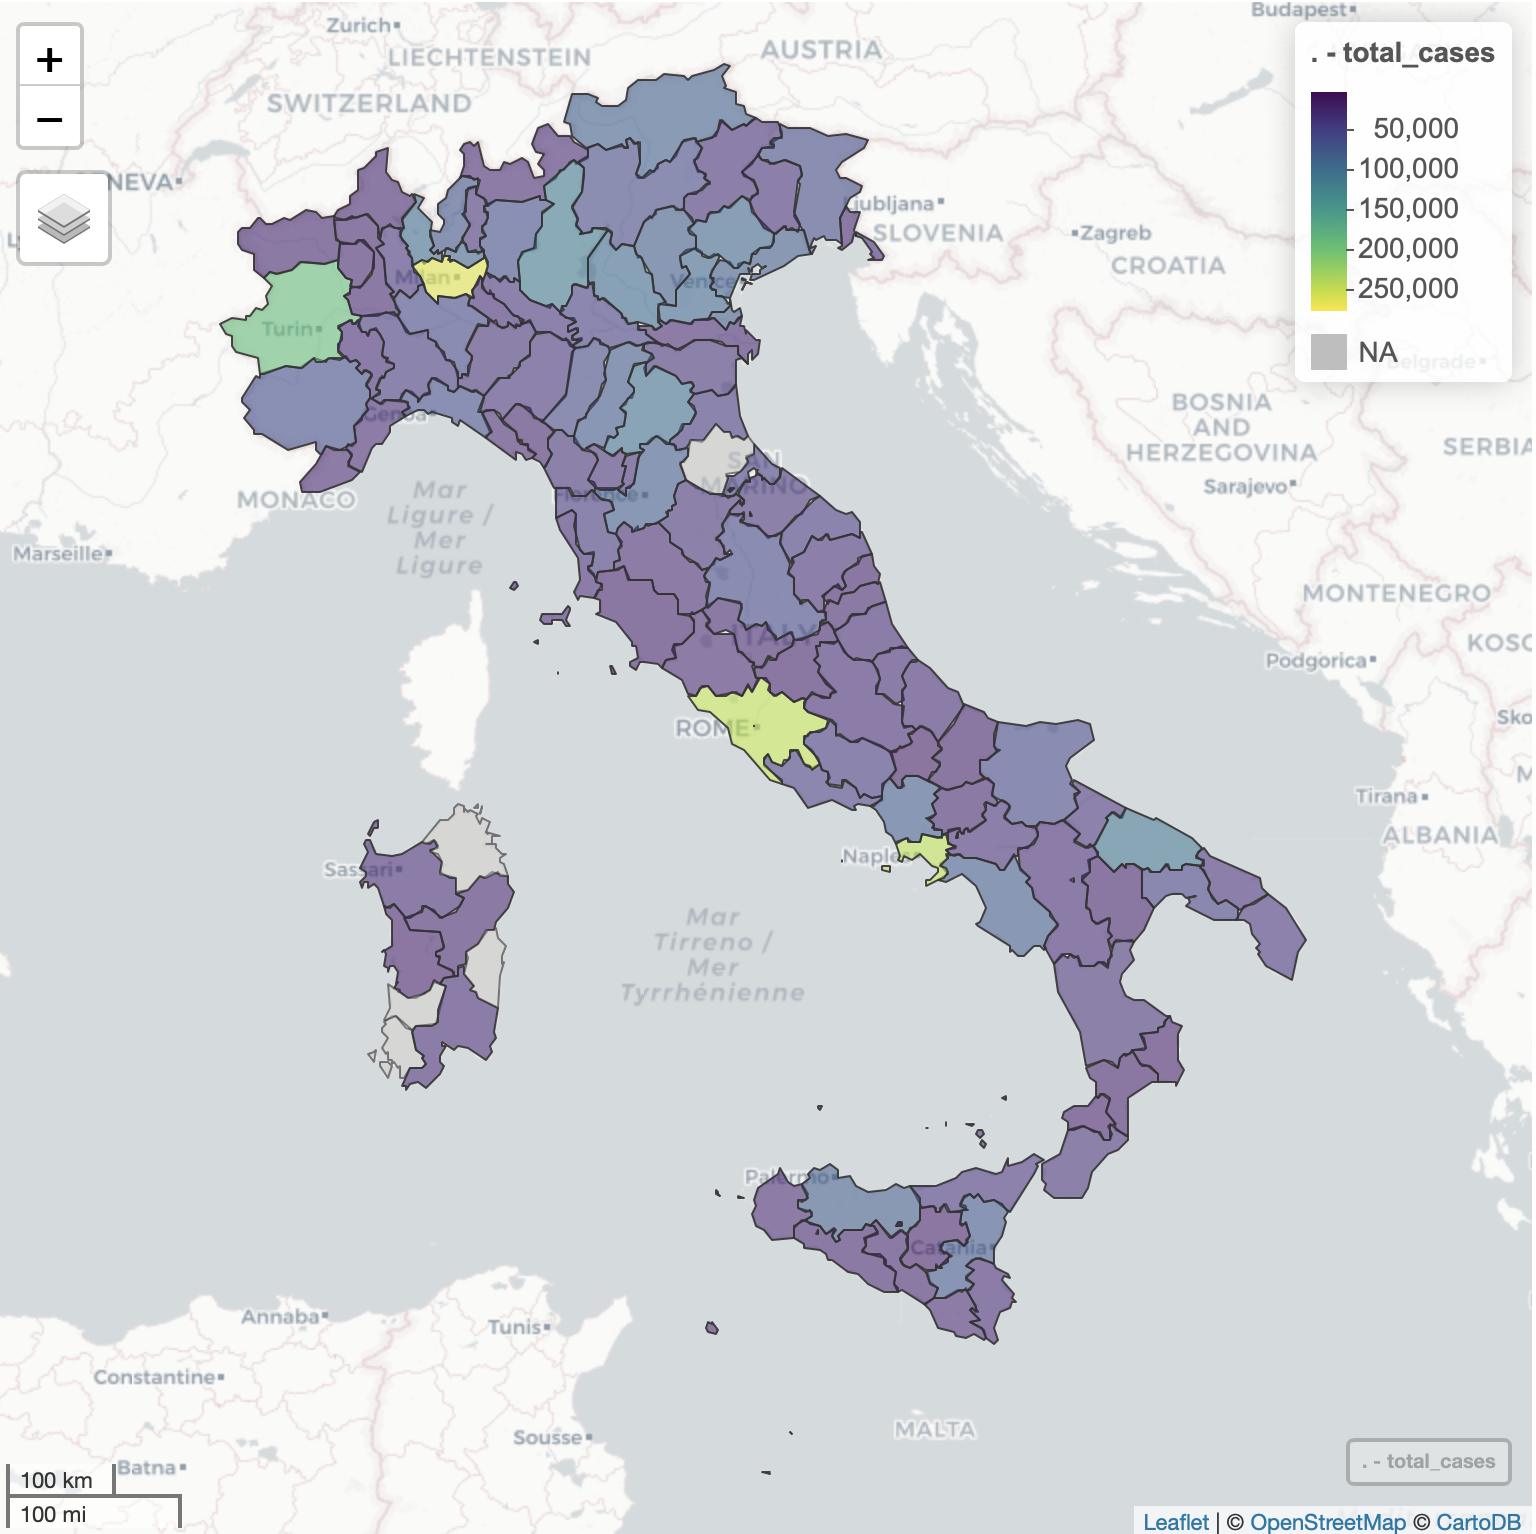
region levelitaly_province - daily summary of the outbreak on the
province levelMore information about the package datasets available here, and supporting dashboard available here.
Data source: Italy Department of Civil Protection
You can install the released version of covid19italy from CRAN with:
install.packages("covid19italy")Or, install the most recent version from GitHub with:
# install.packages("devtools")
devtools::install_github("RamiKrispin/covid19Italy")While the covid19italy CRAN version
is updated every month or two, the Github (Dev)
version is updated on a daily bases. The update_data
function enables to overcome this gap and keep the installed version
with the most recent data available on the Github version:
library(covid19italy)

update_data()
Note: must restart the R session to have the updates available
data(italy_total)

head(italy_total)
#>         date hospitalized_with_symptoms intensive_care total_hospitalized home_confinement cumulative_positive_cases daily_positive_cases recovered death positive_clinical_activity
#> 1 2020-02-24                        101             26                127               94                       221                    0         1     7                         NA
#> 2 2020-02-25                        114             35                150              162                       311                   90         1    10                         NA
#> 3 2020-02-26                        128             36                164              221                       385                   74         3    12                         NA
#> 4 2020-02-27                        248             56                304              284                       588                  203        45    17                         NA
#> 5 2020-02-28                        345             64                409              412                       821                  233        46    21                         NA
#> 6 2020-02-29                        401            105                506              543                      1049                  228        50    29                         NA
#>   positive_surveys_tests cumulative_cases total_tests total_people_tested new_intensive_care total_positive_molecular_test total_positive_rapid_antigen_test molecular_test rapid_antigen_test
#> 1                     NA              229        4324                  NA                 NA                            NA                                NA             NA                 NA
#> 2                     NA              322        8623                  NA                 NA                            NA                                NA             NA                 NA
#> 3                     NA              400        9587                  NA                 NA                            NA                                NA             NA                 NA
#> 4                     NA              650       12014                  NA                 NA                            NA                                NA             NA                 NA
#> 5                     NA              888       15695                  NA                 NA                            NA                                NA             NA                 NA
#> 6 NA 1128 18661 NA NA NA NA NA NAlibrary(plotly)
plot_ly(data = italy_total,
x = ~ date,
y = ~home_confinement,
name = 'Home Confinement',
fillcolor = '#FDBBBC',
type = 'scatter',
mode = 'none',
stackgroup = 'one') %>%
add_trace( y = ~ hospitalized_with_symptoms,
name = "Hospitalized with Symptoms",
fillcolor = '#E41317') %>%
add_trace(y = ~intensive_care,
name = 'Intensive Care',
fillcolor = '#9E0003') %>%
layout(title = "Italy - Distribution of Active Covid19 Cases",
legend = list(x = 0.8, y = 0.9),
yaxis = list(title = "Number of Cases"),
xaxis = list(title = "Source: Italy Department of Civil Protection"))

plot_ly(data = italy_total,
        x = ~ date,
        y = ~ cumulative_positive_cases,
        name = 'Active',
        fillcolor = '#1f77b4',
        type = 'scatter',
        mode = 'none',
        stackgroup = 'one') %>%
  add_trace( y = ~ death,
             name = "Death",
             fillcolor = '#E41317') %>%
  add_trace(y = ~recovered,
            name = 'Recovered',
            fillcolor = 'forestgreen') %>%
  layout(title = "Italy - Distribution of Covid19 Cases",
         legend = list(x = 0.1, y = 0.9),
         yaxis = list(title = "Number of Cases"),
         xaxis = list(title = "Source: Italy Department of Civil Protection"))
italy_region %>%
  filter(date == max(date)) %>%
  select(region_name, cumulative_positive_cases, recovered, death, cumulative_cases) %>%
  arrange(-cumulative_cases) %>%
  mutate(region = factor(region_name, levels = region_name)) %>%
  plot_ly(y = ~ region,
          x = ~ cumulative_positive_cases,
          orientation = 'h',
          text =  ~ cumulative_positive_cases,
          textposition = 'auto',
          type = "bar",
          name = "Active",
          marker = list(color = "#1f77b4")) %>%
  add_trace(x = ~ recovered,
            text =  ~ recovered,
            textposition = 'auto',
            name = "Recovered",
            marker = list(color = "forestgreen")) %>%
  add_trace(x = ~ death,
            text =  ~ death,
            textposition = 'auto',
            name = "Death",
            marker = list(color = "red")) %>%
  layout(title = "Cases Distribution by Region",
         barmode = 'stack',
         yaxis = list(title = "Region"),
         xaxis = list(title = "Number of Cases"),
         hovermode = "compare",
         legend = list(x = 0.65, y = 0.9),
         margin =  list(
           l = 20,
           r = 10,
           b = 10,
           t = 30,
           pad = 2
)) 
italy_province %>%
  filter(date == max(date), region_name == "Lombardia") %>%
  plot_ly(labels = ~province_name, values = ~total_cases,
                  textinfo="label+percent",
                  type = 'pie') %>%
  layout(title = "Lombardia - Cases Distribution by Province") %>%
  hide_legend()
A supporting dashboard for the covid19italy datasets available here.