This R package extends package arules with various visualization techniques for association rules and itemsets. The package also includes several interactive visualizations for rule exploration.
The following R packages use arulesViz: arules, fdm2id, rattle, TELP
To cite package ‘arulesViz’ in publications use:
Hahsler M (2017). “arulesViz: Interactive Visualization of Association Rules with R.” R Journal, 9(2), 163-175. ISSN 2073-4859, doi:10.32614/RJ-2017-047 https://doi.org/10.32614/RJ-2017-047, https://journal.r-project.org/archive/2017/RJ-2017-047/RJ-2017-047.pdf.
@Article{,
  title = {arules{V}iz: {I}nteractive Visualization of Association Rules with {R}},
  author = {Michael Hahsler},
  year = {2017},
  journal = {R Journal},
  volume = {9},
  number = {2},
  pages = {163--175},
  url = {https://journal.r-project.org/archive/2017/RJ-2017-047/RJ-2017-047.pdf},
  doi = {10.32614/RJ-2017-047},
  month = {December},
  issn = {2073-4859},
}
This might also require the development version of arules.
ggplot2 (default engine
for most methods), grid, base (R base plots),
htmlwidget (powered by plotly and
visNetwork).grid,
plotly and visNetwork.datatable.ruleExplorer.Available Visualizations
Stable CRAN version: Install from within R with
install.packages("arulesViz")Current development version: Install from r-universe.
install.packages("arulesViz",
    repos = c("https://mhahsler.r-universe.dev",
"https://cloud.r-project.org/"))Mine some rules.
library("arulesViz")
data("Groceries")
rules <- apriori(Groceries, parameter = list(support = 0.005, confidence = 0.5))
## Apriori
##
## Parameter specification:
## confidence minval smax arem aval originalSupport maxtime support minlen
## 0.5 0.1 1 none FALSE TRUE 5 0.005 1
## maxlen target ext
## 10 rules TRUE
##
## Algorithmic control:
## filter tree heap memopt load sort verbose
## 0.1 TRUE TRUE FALSE TRUE 2 TRUE
##
## Absolute minimum support count: 49
##
## set item appearances ...[0 item(s)] done [0.00s].
## set transactions ...[169 item(s), 9835 transaction(s)] done [0.00s].
## sorting and recoding items ... [120 item(s)] done [0.00s].
## creating transaction tree ... done [0.00s].
## checking subsets of size 1 2 3 4 done [0.00s].
## writing ... [120 rule(s)] done [0.00s].
## creating S4 object ... done [0.00s].plot(rules)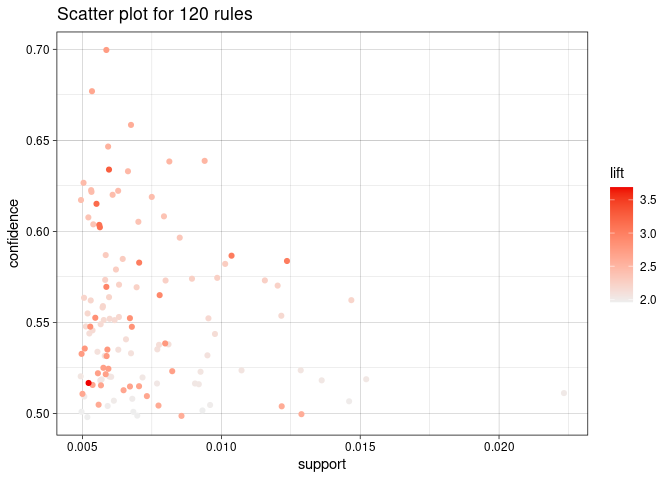
plot(rules, method = "graph", limit = 20)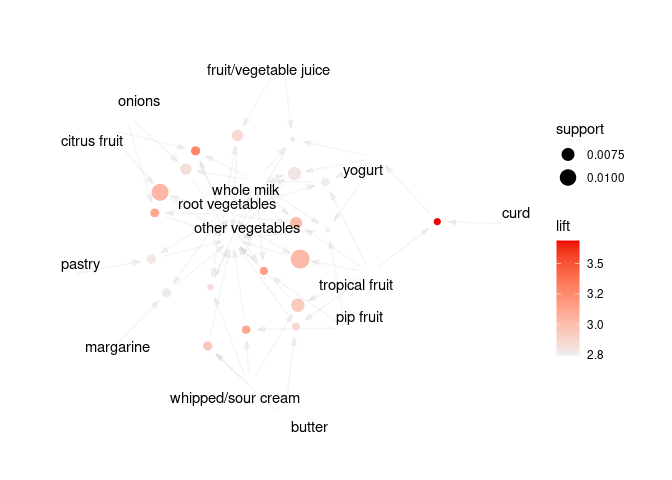
Live examples for interactive visualizations can be seen in Chapter 5 of An R Companion for Introduction to Data Mining