CoDaImpact provides additional tools for the interpretation of regression CoDa models. It is conceived as an extension of the compositions package.
You can install the development version of CoDaImpact from GitHub with:
# install.packages("devtools")
devtools::install_github("LukeCe/CoDaImpact")Below, we estimate a CoDa model that explains the market shares of five
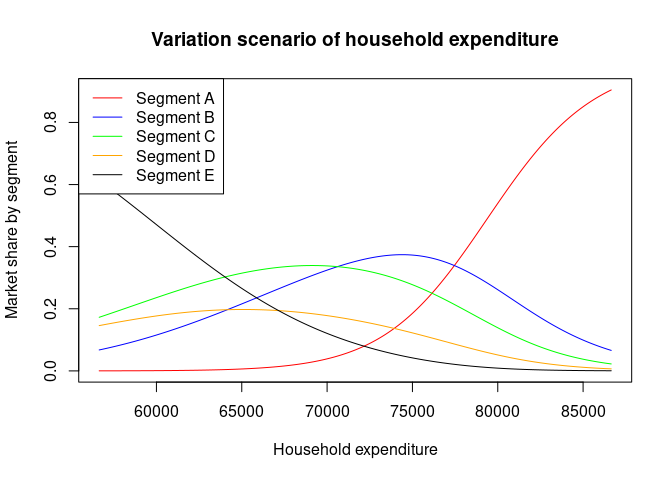
segments of the car market in France. To illustrate the influence of
the HOUSEHOLD_EXPENDITURE on the market shares in each
segment we use a VariationScenario(). In this scenario the
HOUSEHOLD_EXPENDITURE is moved along a grid while all other
variables are fixed to the values of the first observation.
library("CoDaImpact")
data("car_market")

model_car_segements <- lmCoDa(
  ilr(cbind(SEG_A, SEG_B, SEG_C, SEG_D, SEG_E)) ~
    GDP + HOUSEHOLD_EXPENDITURE + GAS_PRICE,
  data = car_market)

VS <- VariationScenario(
  model_car_segements,
  Xvar = "HOUSEHOLD_EXPENDITURE",
  obs = 1,
  inc_size = 100,
  n_steps = 150,
  add_opposite = TRUE)


plot(x = VS$HOUSEHOLD_EXPENDITURE, y = VS$Y[,1],type = "l", col = "red",
     main = "Variation scenario of household expenditure",
     xlab = "Household expenditure", ylab = "Market share by segment")
lines(x = VS$HOUSEHOLD_EXPENDITURE, y = VS$Y[,2],type = "l", col = "blue" )
lines(x = VS$HOUSEHOLD_EXPENDITURE, y = VS$Y[,3],type = "l", col = "green")
lines(x = VS$HOUSEHOLD_EXPENDITURE, y = VS$Y[,4],type = "l", col = "orange")
lines(x = VS$HOUSEHOLD_EXPENDITURE, y = VS$Y[,5],type = "l", col = "black")
legend("topleft",
       legend = paste0("Segment ", LETTERS[1:5]),
       col = c("red", "blue", "green", "orange", "black"),
       lty = 1)